

5M chart of GBP/USD
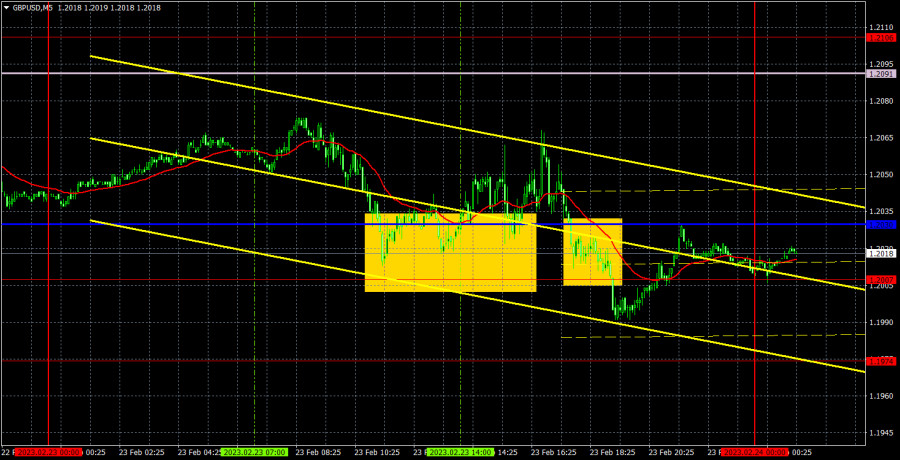
GBP/USD also continued a new round of downward movement on Thursday. The movements were not flat, like the euro, but chaotic. Constant pullbacks, corrections, jagged reversals. In general, now is not the most favorable time to trade. Nevertheless, the pair is steadily declining and is below the Ichimoku indicator lines. Therefore, we can only expect further decline now. This week, the general trend was slightly spoiled by reports from the UK on business activity, which unexpectedly turned out to be much stronger than forecasts. If not for them, the pound would move down after the euro. The Federal Reserve's minutes did not have a particularly strong effect on the pair's movement and separately on the dollar. And on Friday there will be a little more news, but they will also be of a secondary nature. I believe that the most important thing now is the market's mood. And it is bearish. Therefore, I expect the pair to fall further.
Speaking of trading signals, everything was very difficult. The price bounced twice from the 1.2007-1.2030 area, but in each case, it managed to move up only 20-25 points. It's good that at least that much has passed, because traders were able to set Stop Loss to breakeven for each transaction. According to these Stop Losses, long positions were closed. The third sell signal in the same area should not have been worked out, since the first two turned out to be false. And it formed quite late. As a result, neither profit nor loss was obtained.
COT report:
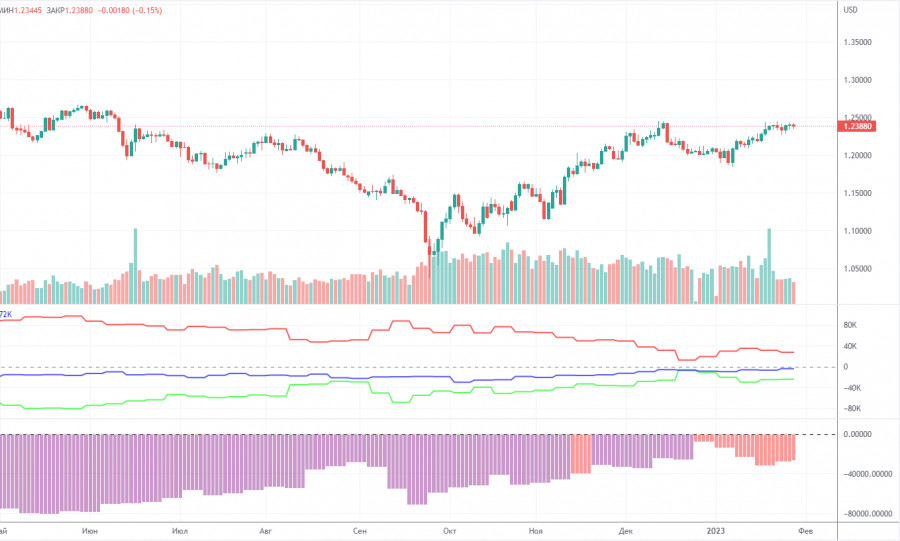
The latest COT report on the British pound showed that the market sentiment has become less bearish. In a week, the non-commercial group of traders closed 6,700 buy contracts and 7,500 sell contracts. As a result, the non-commercial net position increased by 800. The value of the net position has been steadily rising in recent months. So, in the near future, large market players may become more bullish on the pair. It is very hard to say from the fundamental point of view why the pound has advanced so much against the US dollar. It is very likely that in the medium term, the pound will extend its decline as there is still the need for a correction. In general, COT reports have been in line with the trajectory of the pound, so it is all quite logical. Since the net position has not turned bullish yet, traders may continue to buy the pound on condition that the fundamental background is strong enough. The non-commercial group of traders has a total of 35,000 opened buy contracts and 59,000 sell contracts. I am still rather skeptical about the long-term uptrend in the pound. The fundamental and geopolitical backgrounds do not favor a strong and swift rise in the British currency.
1H chart of GBP/USD
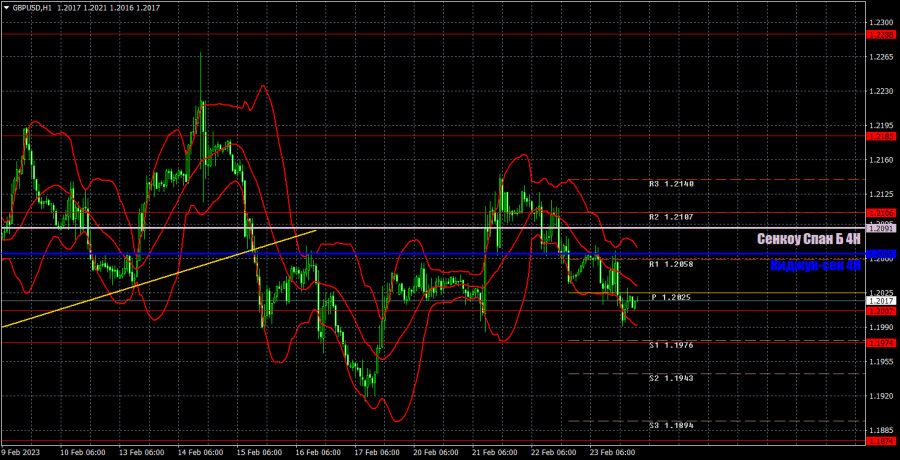
On the one-hour chart, GBP/USD demonstrated a new upward movement and reached the important Senkou Span B line. It failed to overcome this line, and this is the second unsuccessful attempt to settle above it. So we are still in favor of keeping the bearish mood and downward movement of the British currency. On February 24, it is recommended to trade at the key level of 1.1760, 1.1874, 1.1974-1.2007, 1.2106, 1.2185, 1.2288, 1.2342, 1.2429. The Senkou Span B (1.2091) and Kijun Sen (1.2065) lines can also generate signals. Rebounds and breakouts from these lines can also serve as trading signals. It is better to set the Stop Loss at breakeven as soon as the price moves by 20 pips in the right direction. The lines of the Ichimoku indicator can change their position throughout the day which is worth keeping in mind when looking for trading signals. On the chart, you can also see support and resistance levels where you can take profit. On Friday, the UK will release a retail sales report, while the US will release the index of consumer sentiment and personal income with expenditures of the US population. I believe that the market's reaction to this data can only be a last resort. Such as Tuesday's UK business activity data.
Indicators on charts:
Resistance/support - thick red lines, near which the trend may stop. They do not make trading signals.
Kijun-sen and Senkou Span B are the Ichimoku indicator lines moved to the hourly timeframe from the 4-hour timeframe. They are also strong lines.
Extreme levels are thin red lines, from which the price used to bounce earlier. They can produce trading signals.
Yellow lines are trend lines, trend channels, and any other technical patterns.
Indicator 1 on the COT chart is the size of the net position of each trader category.
Indicator 2 on the COT chart is the size of the net position for the Non-commercial group of traders.
The material has been provided by InstaForex Company - www.instaforex.comfrom Forex analysis review https://ift.tt/FHudqcT
via IFTTT