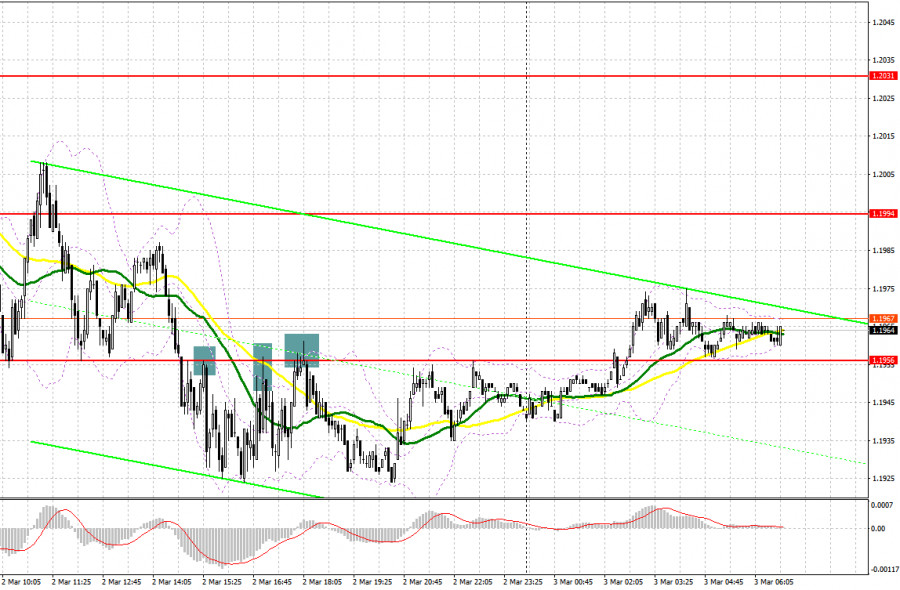
Yesterday, the pair formed several good entry signals. Let's see what happened on the 5-minute chart. In my morning review, I mentioned the level of 1.1970 as a possible entry point. A decline to this level and its false breakout formed a buy signal but the price failed to develop a proper upward movement. In the second half of the day, the pair came under pressure again. It broke through the level of 1.1956 and retested it, thus generating a good sell signal. As a result, the pound dropped by 30 pips. In the New York session, the pair did not form any more entry signals.

For long positions on GBP/USD:
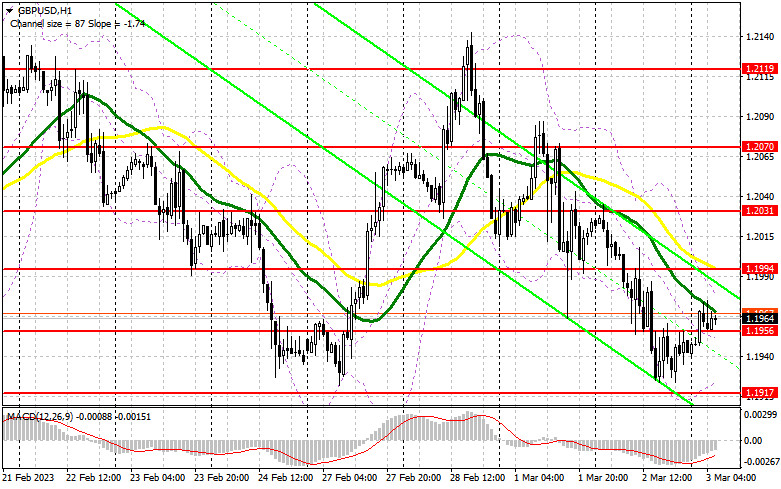
Today, the further trajectory of the pound will fully depend on the UK Services PMI and Markit Composite PMI. Analysts expect to see a rise in these indicators which may potentially help the pound rebound from the monthly lows. Another test of the 1.1917 level may end with a breakout. But before reaching 1.1917, bulls may assert their strength at the interim support of 1.1956. A false breakout at this level following a strong report on services PMI will form a buy signal that may develop into an upside correction to the area of 1.1994, an interim resistance where moving averages support the bears. I will bet on the pair's further rise to the high of 1.2031 only if the price settles at 1.1994 and retests it from top to bottom. If the price breaks above 1.2031, it may head for the next upward target at 1.2070 where I'm going to take profit. If bulls fail to open positions at 1.1956 in the first half of the day under strong selling pressure, bears will act more aggressively and may resume the downtrend. If so, you should open long positions only at the next support of 1.1917 and only in case of a false breakout. I will buy GBP/USD right after a rebound from the low of 1.1875, keeping in mind an intraday correction of 30-35 pips.
For short positions on GBP/USD:
Bears reached all their targets yesterday and continue to exert pressure on the pound to take full control of the market. To develop a stronger movement, they need to protect the nearest resistance of 1.1994 and gain control of the interim support level at 1.1956 that was formed at the close of yesterday's session. A rise to 1.1994 and ist false breakout in the first half of the day following the strong PMI data will act as a great sell signal that may push GBP/USD to the nearest support area of 1.1956. Its breakout and a retest will cancel the plan of the bulls to develop an upside correction. So, bears and large market players will increase their presence in the market, forming a good sell signal with the target at 1.1917 where the price has headed for the fourth time. The level of 1.1875 will serve as the lowest target where I'm going to take profit. If GBP/USD rises and bears are idle at 1.1994, bulls will enter the market again. In this case, bears will retreat until a false breakout at the next resistance of 1.2031 creates an entry point into short positions. If nothing happens there as well, I will sell GBP/USD right from the high of 1.2070, considering a pullback of 30-35 pips within the day.

COT report:
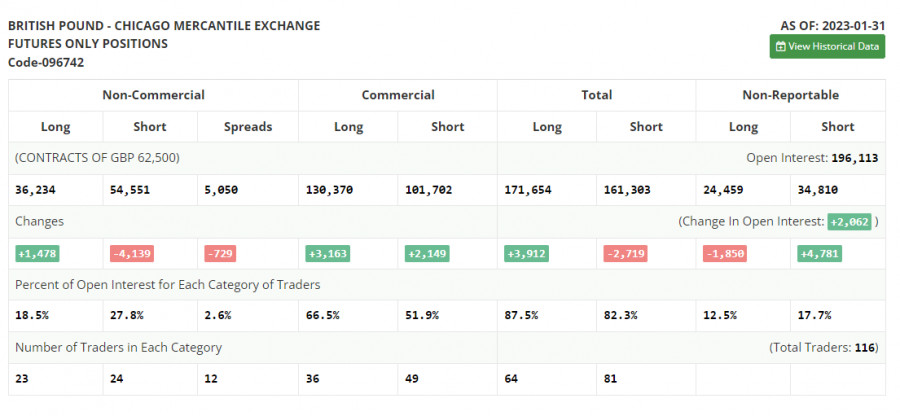
The Commitments of Traders report for January 31 recorded a rise in long positions and a drop in the short ones. Apparently, traders were betting on further rate hikes by the Bank of England and preferred to leave the market before the policy meeting. However, this data is not of big importance at the moment. After a cyber attack on the CFTC, fresh figures are not out yet so the data from a month ago is actually not that relevant. Let's wait for new COT reports to get a better understanding of the market. This week, we don't expect any key economic reports from the US which means that pressure on risk assets may finally ease. In theory, this may allow the pound to develop an upside correction against the US dollar. According to the latest COT report, short positions of the non-commercial group of traders decreased by 4,139 to 54,551, while long positions rose by 1,478 to 36,234. As a result, the negative value of the non-commercial net position decreased to -18,317 from -23,934 recorded a week ago. The weekly closing price declined to 1.2333 from 1.2350.

Indicator signals:
Moving Averages
Trading below the 30- and 50-day moving averages indicates that bears are trying to regain control.
Please note that the time period and levels of the moving averages are analyzed only for the H1 chart, which differs from the general definition of the classic daily moving averages on the D1 chart.
Bollinger Bands
If the pair advances, the upper band of the indicator at 1.1975 will serve as resistance. In case of a decline, the lower band of the indicator at 1.1920 will act as support.
Description of indicators:
• A moving average of a 50-day period determines the current trend by smoothing volatility and noise; marked in yellow on the chart;
• A moving average of a 30-day period determines the current trend by smoothing volatility and noise; marked in green on the chart;
• MACD Indicator (Moving Average Convergence/Divergence) Fast EMA with a 12-day period; Slow EMA with a 26-day period. SMA with a 9-day period;
• Bollinger Bands: 20-day period;
• Non-commercial traders are speculators such as individual traders, hedge funds, and large institutions who use the futures market for speculative purposes and meet certain requirements;
• Long non-commercial positions represent the total number of long positions opened by non-commercial traders;
• Short non-commercial positions represent the total number of short positions opened by non-commercial traders;
• The non-commercial net position is the difference between short and long positions of non-commercial traders.
The material has been provided by InstaForex Company - www.instaforex.comfrom Forex analysis review https://ift.tt/Fmia8GK
via IFTTT
