

Analyzing Monday's trades:
EUR/USD on 30M chart
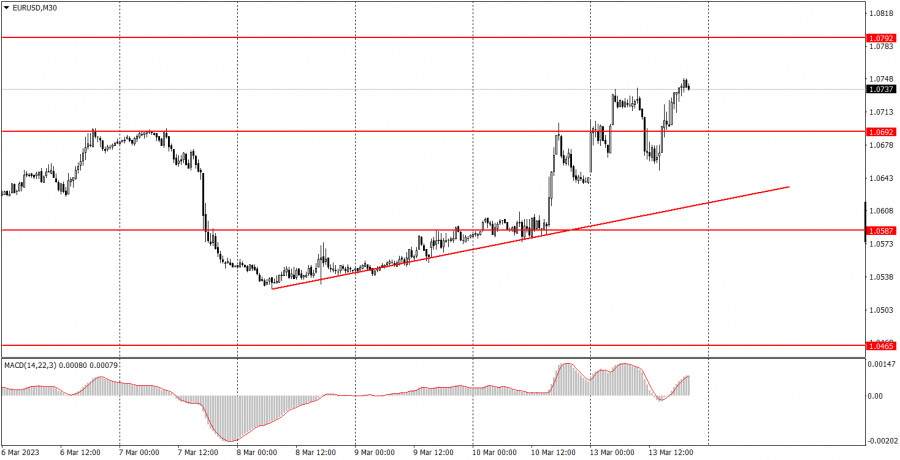
EUR/USD continued the upward movement, which started last Friday. To briefly remind you of what happened, several important reports were released last Friday, which was perceived by the market in an ambiguous manner. To put it simply, there was some data both in favor of the dollar and against it, but the market paid attention only to the latter, so the dollar sharply fell. During the weekend, the bankruptcy of two big banks in the US were announced, so the dollar was under pressure at the start of the week. However, it managed to rise and fall on Monday. I believe that the current market condition is not very favorable and stable, so just about any kind of trend can be expected. The Federal Reserve and U.S. President Joe Biden said that they will do their best to stabilize the banking system and prevent new bankruptcies. But for now, the dollar is in a downward movement, as evidenced by the trend line in the chart.
EUR/USD on 5M chart
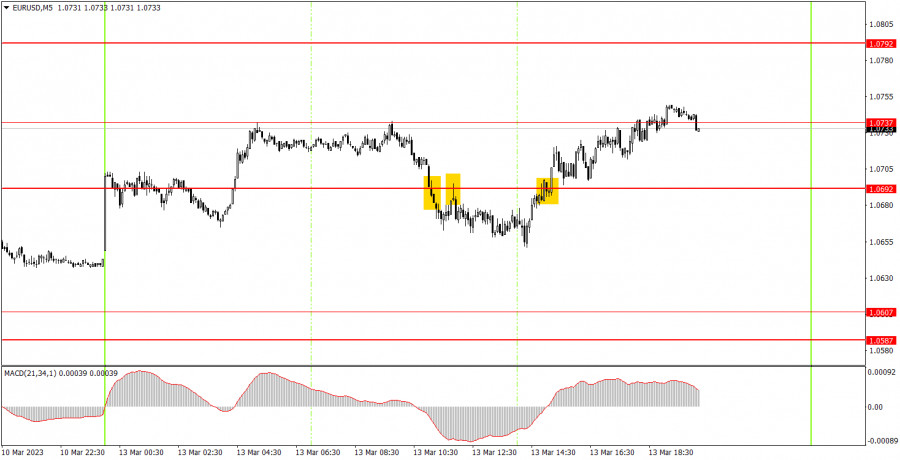
On the 5-minute chart, the pair has changed direction at least three times. By the end of the day, it was rising again, but nevertheless the factors, which we mentioned above, can not influence the USD for a long time. We think that the market should normalize soon, so we expect the dollar to rise. In the meantime, about the signals. Half of the upward movement occurred during the Asian trading session. Trades were calmer during the European and US sessions. All the signals were formed near 1.0692, and the 1.0737 level is new. After the sell signal, the price went down just 25 points, so beginners could only place a Stop Loss at breakeven. The buy signal was better, and the price passed in the right direction of 35-40 pips. The position should have been closed manually closer to the evening, and the profit was obtained.
Trading tips on Tuesday:
On the 30-minute chart, the pair forms a new uptrend, but it may be short-lived, as it is based on market emotions. The trend line is quite formal, but consolidating below it may help determine the moment to enter a new spiral of movement to the downside. On the 5-minute chart, it is recommended to trade at the levels 1.0535, 1.0587-1.0607, 1.0692, 1.0737, 1.0792, 1.0857-1.0867, 1.0920-1.0933. As soon as the price passes 15 pips in the right direction, you should set a Stop Loss to breakeven. On Tuesday, no important events and reports are scheduled in the European Union, while the U.S. inflation report for February will be released. Naturally, this will be the "event of the week" and the reaction of the market, which is already in an excited condition, can be very strong.
Basic rules of the trading system:
1) The strength of the signal is determined by the time it took the signal to form (a rebound or a breakout of the level). The quicker it is formed, the stronger the signal is.
2) If two or more positions were opened near a certain level based on a false signal (which did not trigger a Take Profit or test the nearest target level), then all subsequent signals at this level should be ignored.
3) When trading flat, a pair can form multiple false signals or not form them at all. In any case, it is better to stop trading at the first sign of a flat movement.
4) Trades should be opened in the period between the start of the European session and the middle of the US trading hours when all positions must be closed manually.
5) You can trade using signals from the MACD indicator on the 30-minute time frame only amid strong volatility and a clear trend that should be confirmed by a trendline or a trend channel.
6) If two levels are located too close to each other (from 5 to 15 pips), they should be considered support and resistance levels.
On the chart:
Support and Resistance levels are the levels that serve as targets when buying or selling the pair. You can place Take Profit near these levels.
Red lines are channels or trend lines that display the current trend and show in which direction it is better to trade now.
The MACD indicator (14, 22, and 3) consists of a histogram and a signal line. When they cross, this is a signal to enter the market. It is recommended to use this indicator in combination with trend patterns (channels and trendlines).
Important announcements and economic reports that can be found on the economic calendar can seriously influence the trajectory of a currency pair. Therefore, at the time of their release, we recommend trading as carefully as possible or exiting the market in order to avoid sharp price fluctuations.
Beginners on Forex should remember that not every single trade has to be profitable. The development of a clear strategy and money management is the key to success in trading over a long period of time.
The material has been provided by InstaForex Company - www.instaforex.comfrom Forex analysis review https://ift.tt/LzR0SD1
via IFTTT