

Analysis of EUR/USD on 5M timeframe
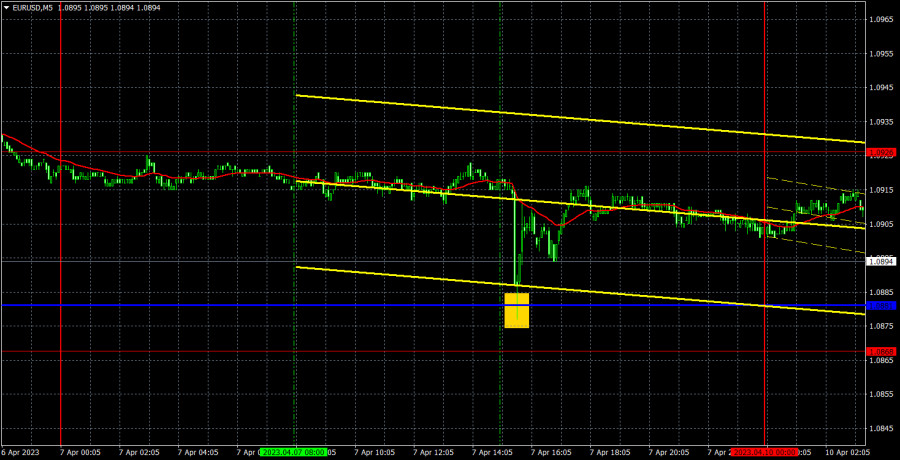
On the last trading day of the last week, the currency pair EUR/USD moved sideways for almost the entire day. This is not surprising since Easter holidays began worldwide. However, at the same time, the United States released important macroeconomic statistics, which was very difficult to ignore. To sum up, EUR/USD remained motionless throughout the day, but it went down when the reports were published. The down move was relevant low volatility which is intrinsic to a holiday-thinned market. A 40-point move is not the reaction which is commonly expected from the unemployment data and nonfarm payrolls. The US dollar could have eventually asserted its strength, but circumstances got in the way again. The statistics from the US were pretty good, but the holiday prevented the bulls from realizing their potential.
Since volatility on Friday was minor, only one trading signal was formed. At the beginning of the American trading session, the pair bounced off the critical level to move up 20-30 points. Opening long positions after quite good employment reports from the US was quite risky. However, the signal turned out to be decent, so traders could make some profit. Considering the low volatility, a 20-point profit is already very good.
COT report
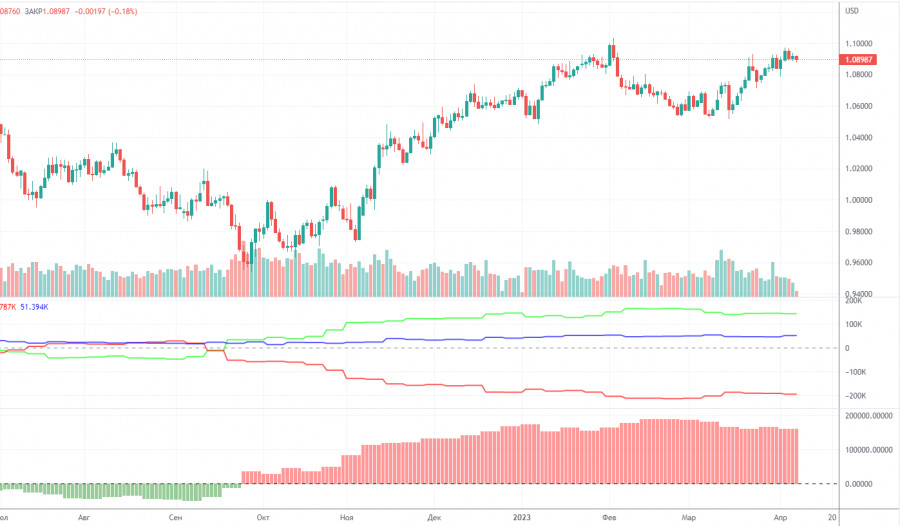
On Friday, a new COT report for April 4th was released. The CFTC has caught up with the lost time and now publishes reports that correspond to the current time period. In the past few months, the picture has been entirely consistent with what has been happening in the market. The picture above clearly shows that the net position of major players (the second indicator) has been growing since the beginning of September 2022. At the same time, the European currency also began to rise. At the moment, the net position of non-commercial traders remains "bullish" and very high, as does the position of the European currency, which cannot even properly correct downward. Importantly, a relatively high "net position" value suggests the scenario that an uptrend will be over soon. This is signaled by the first indicator, where the red and green lines have moved far apart from each other, which often prefaces the end of a trend. The European currency tried to go down, but we have only seen a minor downward retracement so far. During the last reporting week, the number of Buy contracts among the "Non-commercial" group increased by 2.5 thousand, while the number of short contracts rose by 4.1 thousand. Accordingly, the net position has hardly changed. The number of BUY contracts is higher than the number of SELL contracts among non-commercial traders by 143 thousand. A correction is still on the horizon, so even without COT reports, it is clear that EUR/USD should resume its decline.
Analysis of EUR/USD on 1H timeframe
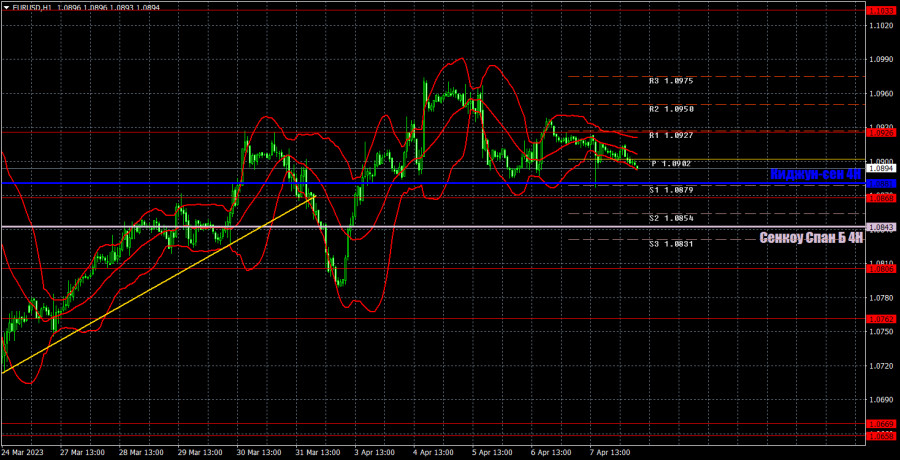
On the 1-hour timeframe, the currency pair has been still following an uptrend even without a new trendline. The the European currency can resume its growth at any moment, even without clear-cut reasons. The fact of a price consolidation below the Ichimoku indicator lines will enable traders to predict a downtrend on the 1-hour timeframe. So far, the instrument finds it difficult even to overcome the critical line. Traders still desperately don't want to sell. For Monday, we highlight the following trading levels: 1.0581, 1.0658-1.0669, 1.0762, 1.0806, 1.0868, 1.0926, 1.1033, 1.1137-1.1185, 1.1234, 1.1274, as well as Senkou Span B (1.0843) and Kijun-sen (1.0881) lines. The Ichimoku indicator lines may move during the day, which should be taken into account when recognizing trading signals. There are also extra support and resistance levels, but signals are not generated around them. The price can give such signals as "bounces" and "breakthroughs" of extreme levels. Don't forget to place a Stop Loss order at breakeven if the price has moved in the right direction by 15 points. This will protect against potential losses if the signal turns out to be false. On April 10th, no important events or publications are scheduled in the European Union and the United States. Most likely, the market will trade with low volatility, making sluggish movements today. EUR/USD is set to trade flat again on the 1-hour timeframe.
Comments on charts
Support and resistance levels are plotted by thick red lines, near which the movement may end. Commonly, they do not generate trading signals.
The Kijun-sen and Senkou Span B lines are the Ichimoku indicator lines transferred to the 1-hour timeframe from the 4-hour timeframe. They are strong lines.
Extreme levels are thin red lines, from which the price bounced or dropped earlier. They are sources of trading signals.
Yellow lines are trend lines, trend channels, and any other technical patterns.
Indicator 1 on the COT charts is the size of the net position of each category of traders.
Indicator 2 on the COT charts is the size of the net position for the Non-commercial group.
The material has been provided by InstaForex Company - www.instaforex.comfrom Forex analysis review https://ift.tt/W35H0VP
via IFTTT