

Analyzing Friday's trades:
EUR/USD on 30M chart
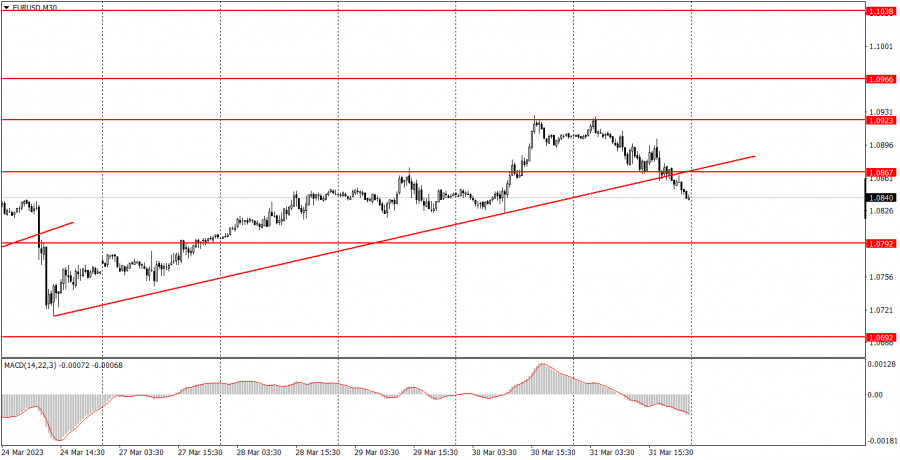
On Friday, EUR/USD finally started to correct. Remember that I previously mentioned that the EU inflation report could provoke a strong reaction of the market, but it is not possible to say what exactly it will be after such a strong and long growth. The report turned out to be as controversial as possible. The consumer price index slowed down to 6.9% in March, which is the biggest decline since the time when inflation started falling (a few months ago). Thus, on the one hand, the euro has fallen justifiably because now it is less likely that the European Central Bank will further aggressively tighten rates. But on the other hand, core inflation has risen again and now stands at 5.7%. At this rate, core inflation will soon simply exceed the headline inflation. And the ECB is interested in two kinds of inflation, not just core inflation. So apparently the euro should have risen again. But, as I mentioned, the euro was already rising for at least five days before that, and for no reason at all.
EUR/USD on 5M chart
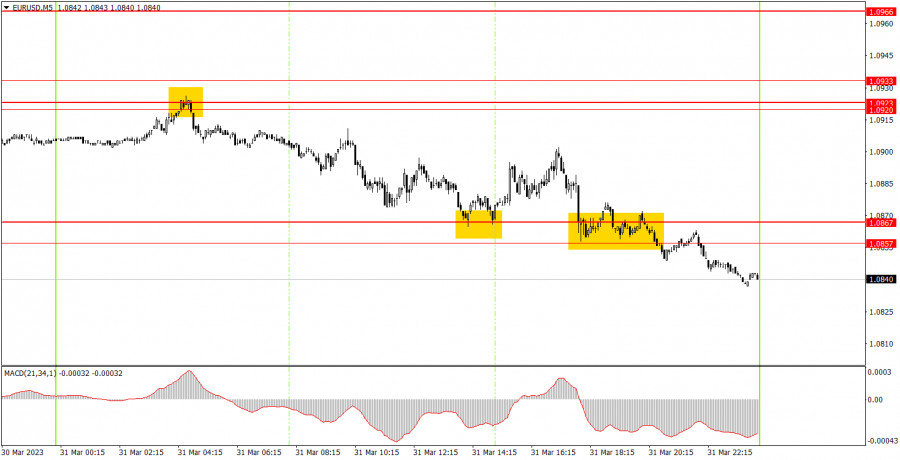
Several trading signals were formed on the 5-minute chart. In the evening, the price rebounded from the important area of 1.0920-1.0933, but at the opening of the European session, the price moved away from the point of formation by only 5 pips, so a short position could be opened. The price eventually fell to 1.0867, from which it bounced and formed a buy signal. The profit on the short position was about 30 pips. Longs did not bring significant profit for beginners, because the price was able to edge up by only 22 points, which, however, was enough for the Stop Loss to be set to Breakeven. The last sell signal was formed too late, so it should not be worked out.
Trading tips on Monday:
On the 30-minute chart, the pair has already consolidated below the new uptrend line, so technically we now have a downtrend. "Formally", because a week earlier, we had exactly the same signal, and the upward movement resumed almost immediately. But nevertheless, I am expecting the euro to fall, and we can expect it to be considerable. On the 5-minute chart, it is recommended to trade at the levels 1.0587-1.0607, 1.0692, 1.0737, 1.0792, 1.0857-1.0867, 1.0920-1.0933, 1.0966, 1.0989, 1.1038, 1.1070. As soon as the price passes 15 pips in the right direction, you should set a Stop Loss to breakeven. On Monday, no important events or reports are scheduled in the European Union, while in the US, a rather important ISM manufacturing index will be released. Traders may react, and we are expecting the pair to fall further anyway.
Basic rules of the trading system:
1) The strength of the signal is determined by the time it took the signal to form (a rebound or a breakout of the level). The quicker it is formed, the stronger the signal is.
2) If two or more positions were opened near a certain level based on a false signal (which did not trigger a Take Profit or test the nearest target level), then all subsequent signals at this level should be ignored.
3) When trading flat, a pair can form multiple false signals or not form them at all. In any case, it is better to stop trading at the first sign of a flat movement.
4) Trades should be opened in the period between the start of the European session and the middle of the US trading hours when all positions must be closed manually.
5) You can trade using signals from the MACD indicator on the 30-minute time frame only amid strong volatility and a clear trend that should be confirmed by a trendline or a trend channel.
6) If two levels are located too close to each other (from 5 to 15 pips), they should be considered support and resistance levels.
On the chart:
Support and Resistance levels are the levels that serve as targets when buying or selling the pair. You can place Take Profit near these levels.
Red lines are channels or trend lines that display the current trend and show in which direction it is better to trade now.
The MACD indicator (14, 22, and 3) consists of a histogram and a signal line. When they cross, this is a signal to enter the market. It is recommended to use this indicator in combination with trend patterns (channels and trendlines).
Important announcements and economic reports that can be found on the economic calendar can seriously influence the trajectory of a currency pair. Therefore, at the time of their release, we recommend trading as carefully as possible or exiting the market in order to avoid sharp price fluctuations.
Beginners on Forex should remember that not every single trade has to be profitable. The development of a clear strategy and money management is the key to success in trading over a long period of time.
The material has been provided by InstaForex Company - www.instaforex.comfrom Forex analysis review https://ift.tt/4MCQXTu
via IFTTT