

The currency pair GBP/USD on Monday also stood still during the first half of the day, and in the second half, it began a rather noticeable decline. The reasons are the same as for the EUR/USD pair. The market blatantly ignored important strong statistics from across the ocean on Friday, so it had to react to them this week. The dollar's growth was long overdue. In recent weeks, the pair has done nothing but grow, often without specific reasons. The pound rose by 700 points almost without a correction, which only caused surprise and bewilderment. However, sooner or later, every fairy tale comes to an end. On Monday, the pair fell, consolidating below the moving average line, and this is the beginning of a strong correction. Of course, we may be wrong. If the market, for some reason, starts to buy the pound and sell the dollar again today, we will see a new round of unfounded growth. Unfortunately, there are periods in the market when one currency or another grows just like that, without visible reasons or a fundamental background. This effect can already be called the "Bitcoin effect." What happens with Bitcoin? Cryptocurrency often grows because it is growing. Since it is growing, more and more investors want to join the trend and profit from it. The same happens (much less often) in the currency market. The currency can grow by inertia or simply because it is growing, as silly as that may sound. But the currency market is much more stable and logical. Behind every currency stands a central bank and the economy of an entire country. Therefore, inertial growth cannot last for long.
On the 24-hour timeframe, the pair can still maintain a sideways channel, as there was no strong consolidation above the 1.2440 level. We warned that the pair might only formally overcome this level, collect Stop Losses, and then collapse again. A new round of a strong decline within the sideways channel 1.1840–1.2440 might begin.
Core inflation - the key to saving the dollar.
We already said yesterday that the inflation indicator, which will be released on Wednesday, is not likely to help the US dollar. The fact is that another significant slowdown in the consumer price index is expected. The faster and more significant the inflation decline, the fewer reasons the Fed has to raise the key rate. However, there is another side to the coin - core inflation. It is expected to increase by 0.1% in March, resulting in an annual rate of 5.6%. Even if the forecast does not come true and inflation remains at the previous level of 5.5%, it will still be a negative factor. Remember that central banks pay more attention to core inflation, which does not consider price changes for volatile energy carriers and food. We do not support the view that core inflation is more important for the Fed than the overall rate, but we still agree that the Fed does not ignore the core CPI. Thus, core inflation can support the US dollar this week. If it grows again, the likelihood of tightening monetary policy in May will increase. After that, everything will again depend on core inflation. If it does not resume its decline by June, another tightening from the Fed can be expected. We remind you that the consensus forecast for the rate allows for growth up to 5.75%.
Therefore, the question of the Fed's rate is not closed. The US economy allows for tightening monetary policy. The labor market allows for tightening monetary policy. These two factors are key to the issue of rates. They allow the Fed to tighten as much as needed. The Bank of England or the ECB does not have such an opportunity, or their opportunity is much less pronounced. That is why we still do not believe that the dollar should depreciate in 2023.
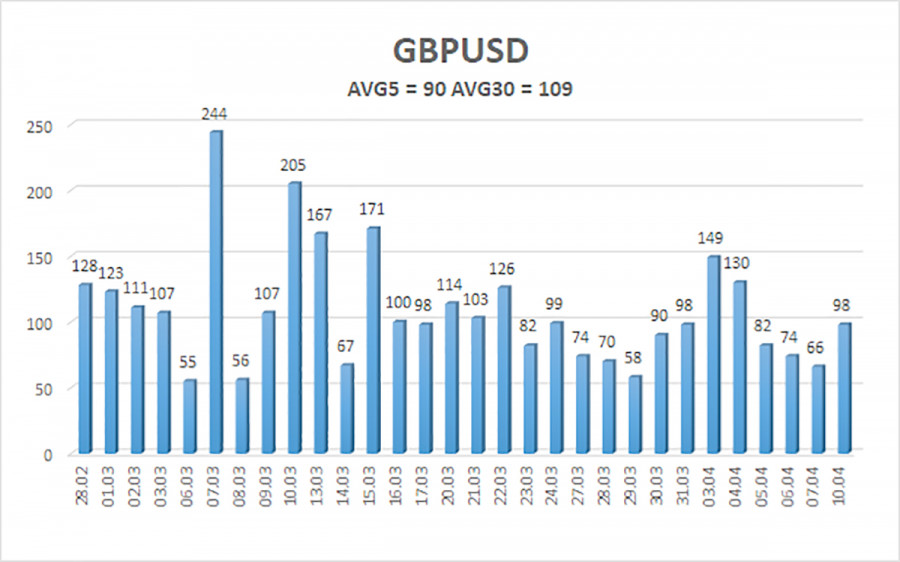
The average volatility of the GBP/USD pair over the last five trading days is 90 points. For the pound/dollar pair, this value is considered "average." We anticipate levels 1.2319 and 1.2499 to restrict the channel's movement on Tuesday, April 11. If the Heiken Ashi indicator turns down, it could mean that the price will continue to go down.
Nearest support levels:
S1 – 1.2390
S2 – 1.2329
S3 – 1.2268
Nearest resistance levels:
R1 – 1.2451
R2 – 1.2512
R3 – 1.2573
Trading recommendations:
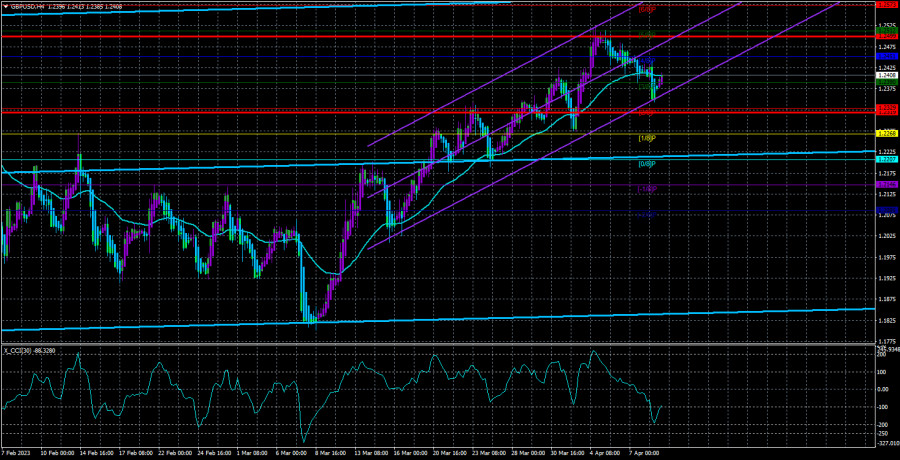
The GBP/USD pair has finally consolidated below the moving average in the 4-hour timeframe. Short positions can be considered with targets of 1.2329 and 1.2268 if the Heiken Ashi indicator turns downward or bounces off the moving average. Long positions can be considered if the price consolidates above the moving average, with targets of 1.2451 and 1.2499.
Explanation of illustrations:
Linear regression channels - help to determine the current trend. If both are directed in one direction, the trend is strong now.
The moving average line (settings 20.0, smoothed) - determines the short-term trend and the direction in which trading should be conducted now.
Murrey levels - target levels for movements and corrections.
Volatility levels (red lines) - the likely price channel the pair will spend the next day, based on current volatility indicators.
CCI indicator - its entry into the oversold area (below -250) or the overbought area (above +250) means that a trend reversal in the opposite direction is approaching.
The material has been provided by InstaForex Company - www.instaforex.comfrom Forex analysis review https://ift.tt/ZwK1QlO
via IFTTT