

GBP/USD:
On Friday, the price tried to test the resistance of the MACD indicator line on the daily chart, but it failed. This pattern often leads to a resumption of the decline rather than a repeated attempt to overcome this line.
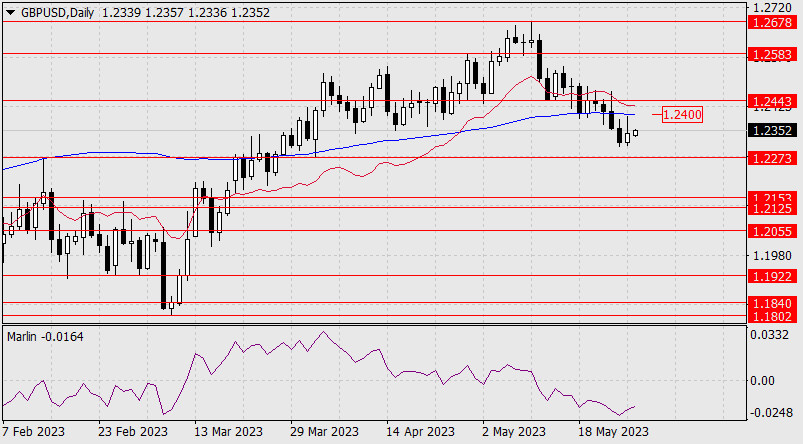
If the main scenario unfolds and the price breaches the support level of 1.2273, the target becomes the range of 1.2125/53, defined by the highs of December 28 and November 24, 2022. Breaking the resistance of the MACD line (1.2400) is not yet a condition for growth, as there is further linear resistance at 1.2443.
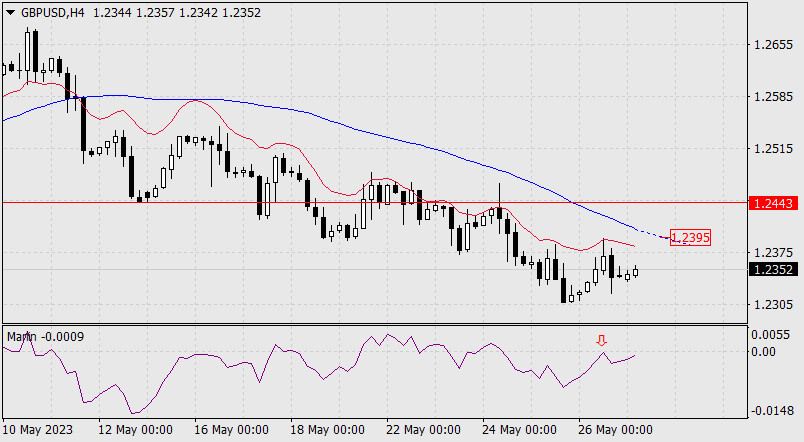
On the four-hour chart, the price reversed from the resistance of the balance indicator line, and the Marlin oscillator's signal line turned downward from the border of the area of the uptrend. The main direction is downward. If the price tries to go for an alternative path, it will encounter resistance at the MACD line (1.2395), the MACD line on the daily chart (1.2400), and the actual linear resistance at 1.2443.
The material has been provided by InstaForex Company - www.instaforex.comfrom Forex analysis review https://ift.tt/lJ3vxdN
via IFTTT