Long-term perspective.

Over the current week, the EUR/USD pair has grown by a seemingly insignificant 250 points. This might not appear substantial at first glance, but the pair saw consistent growth virtually every day throughout the week. Interestingly, this pair was previously stuck in a consolidation phase between $1.05 and $1.11 for six months. It might have been expected to break out of this range due to a significant shift in the fundamental outlook or a major global event. Contrarily, the pair started its upward movement on Monday and continued its rise throughout the week.
This week lacked any significant speeches from Jerome Powell or Christine Lagarde, nor were there any major statements from other Fed or European Central Bank (ECB) representatives. The most noteworthy event of the week was the release of the US inflation report. This was published on Wednesday afternoon, but interestingly, the dollar began to fall on Monday itself, and the decline continued calmly even on Thursday. The market may have responded to the strong inflation report during this time. It's worth remembering that a faster and more substantial decrease in inflation increases the chances of the Fed discontinuing further monetary policy tightening. Nevertheless, as is often the case, the market perceived negative implications for the dollar while overlooking the positive.
It's important to recall that the market didn't expect the 1-2 Fed rate hikes that occurred. A few months back, the market was certain that the May tightening would be the final. However, it became evident that the Fed was preparing for one or two more hikes following Powell's address to Congress. Initially, this led to an increase in "hawkish" expectations, followed by a softening. Despite this, the dollar didn't appreciate the strengthening expectations but depreciated during the softening.
Inflation in June decreased to 3%, only 0.1% lower than predicted. So, was the market adjusting to the 0.1% deviation from the forecast on Wednesday and Thursday? Isn't four days a disproportionately long time to adjust to a single report? We believe the market has transitioned into a new "bullish" phase, which has little to do with the fundamental situation.
Now, let's proceed to the COT analysis.

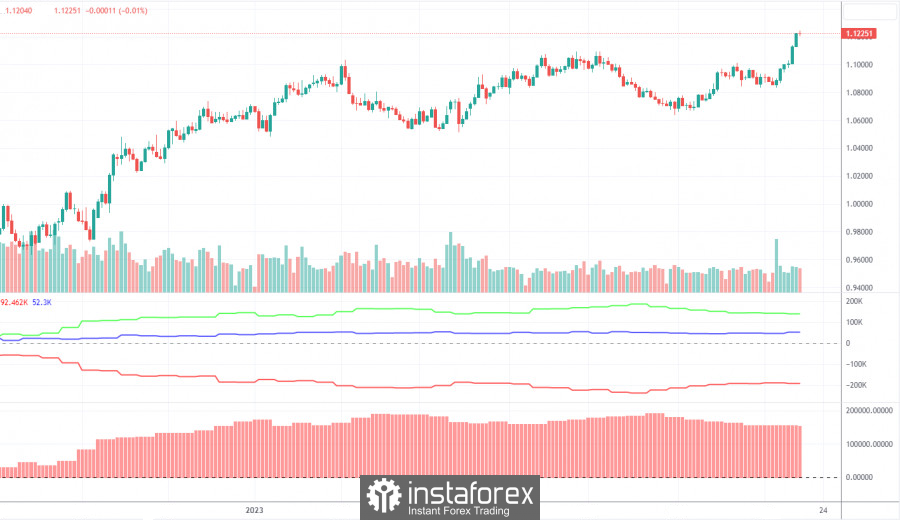
On Friday, the COT report for July 11 was released, and it has been in sync with market dynamics for the past ten months. It is evident from the above illustration that the net position of key players (second indicator) started to ascend from September 2022, coinciding with the rise of the European currency. Although the net position has remained stable for the last five months, the euro remains strong. Non-commercial traders' net position is 'bullish' and strong, while the European currency continues to gain against the dollar.
We have previously alerted traders that an elevated 'net position' value could signify the potential end of an upward trend. This is indicated by the first indicator, where the red and green lines have dramatically diverged from each other, often indicating a trend's end. Over the last reporting week, the 'Non-commercial' group's buy contracts increased by 3.0 thousand, while shorts expanded by 5.7 thousand. Therefore, the net position decreased by 2.7 thousand contracts. The falling net position and rising euro present a logical inconsistency. Non-commercial traders' buy contracts surpass sell contracts by 140 thousand, a substantial gap of nearly three times the difference. Generally, even without the COT reports, the European currency should depreciate, yet the market is reluctant to sell.
Analysis of fundamental events.
This week, there were minimal significant events in the European Union. Notable ones included ZEW's economic expectations indices, industrial production, and Philip Lane's address. All three events were weaker than anticipated but did not hinder the euro's growth. Lane's speech could have been better. No supportive factors for the euro emanated from the European Union. We aregain led to discuss the solitary US inflation report, but it's challenging to believe the market adjusted for it over four days.
Significant movements were only expected at the week's start on Wednesday. Despite the weak macroeconomic background, the euro displayed nearly the most substantial growth over the previous six months. The pair has witnessed some inexplicable movements and is now at its peak.
Trading plan for the week of July 17 - 21:
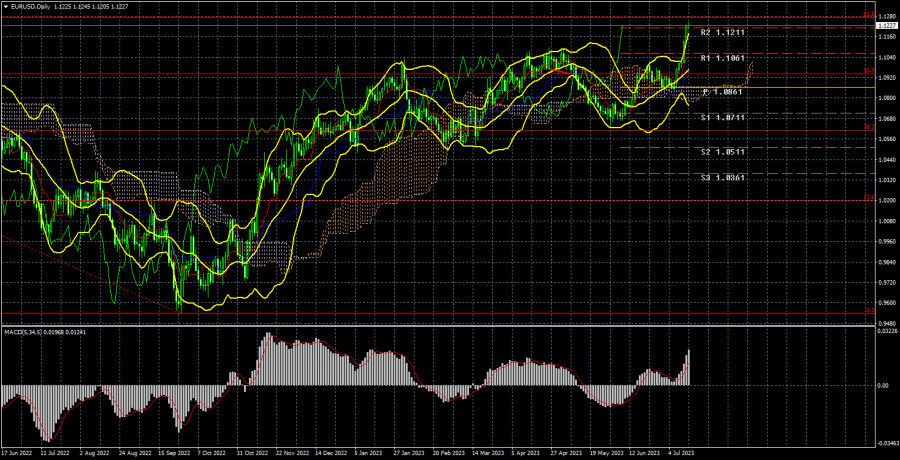
In the 24-hour timeframe, the pair unexpectedly resumed the upward trend on hold for six months. The pair surpassed the Fibonacci 50.0% level at 1.0940 and can ascend to the Fibonacci level at 61.8% (1.1270.) Hence, purchases are currently more relevant, while the fundamental reasons for such a movement remain a mystery; in our opinion, there are none. The euro has already appreciated by 1700 points in less than a year, during which the Fed has been hiking rates more aggressively and swiftly than the ECB.
As for selling the euro/dollar pair, one can begin in the 24-hour timeframe after overcoming the Kijun-sen line. The euro remains overbought, suggesting a likely fall, but the market continues to forge an inertial upward trend. Currently, fundamentals and macroeconomics are of secondary importance.
Illustration Descriptions:
The support and resistance price levels and Fibonacci levels serve as the targets when initiating purchase or sale transactions. Take Profit levels may be situated around these.
Ichimoku indicators (default settings), Bollinger Bands (default settings), and MACD (5, 34, 5) are also represented.
Indicator 1 on the COT charts signifies the size of the net position for each category of traders.
Indicator 2 on the COT charts represents the size of the net position for the "Non-commercial" group of traders.
The material has been provided by InstaForex Company - www.instaforex.comfrom Forex analysis review https://ift.tt/M5jRfJo
via IFTTT
