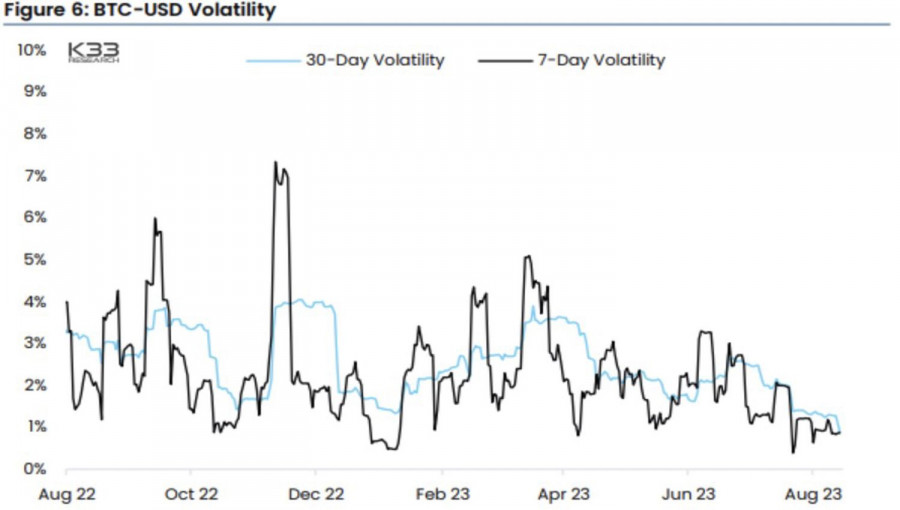
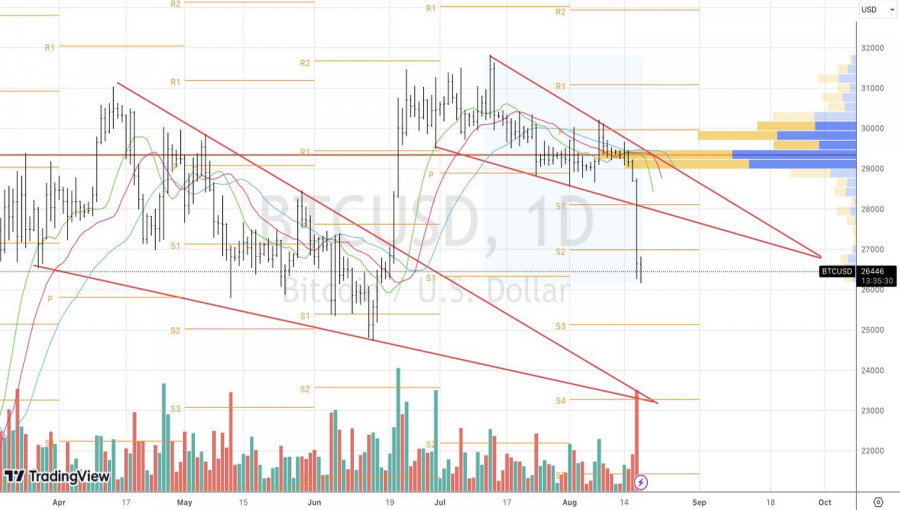
The longer the sleep, the more turbulent the awakening. Bitcoin had been in a state of consolidation for too long, with its 90-day volatility dropping to its lowest level since 2016. Investors began to leave such a dull market, and only the most persistent remained. They caught a good downward movement in BTC/USD on the break of support at 28,900. The token plummeted to a two-month low, and it seems there is still further to go.
Initially, the cryptocurrency market did not respond to the dynamics of U.S. stock indices. It preferred to wait in anticipation of the Securities and Exchange Commission's decision on the ARK 21Shares Bitcoin ETF. The verdict was expected on August 13th, but it did not come. Investors took this as a good sign. It means there is still a possibility that the requests from BlackRock, VanEck, WisdomTree, and Invesco will be approved. The response dates are set for early September.
Bitcoin volatility dynamics

However, time passed, and there was no information on the approval or rejection of the ETF application with Bitcoin as the underlying asset. The market grew tired of waiting and began to react to the factors that had previously driven it. In particular, it responded to the worsening global risk appetite amid falling U.S. stock indices.
U.S. stocks are facing active competition from bonds. The rise in bond yields makes the S&P 500 overvalued, increases borrowing costs for corporations, and reduces future earnings. At the heart of the rally is the remarkable resilience of the U.S. economy to adversity in the form of aggressive monetary tightening by the Fed, an increasing budget deficit and national debt, and the associated massive issuance of Treasury bonds. In the third quarter alone, the Treasury is prepared to issue $1 trillion in securities.
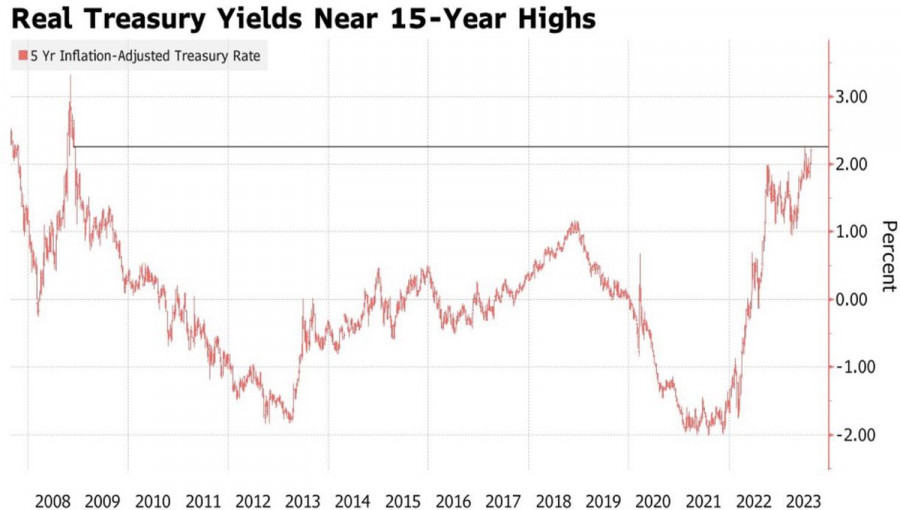
Adding to this the Fed's quantitative tightening program, the prolonged holding of the federal funds rate at a plateau of 5.5%, or its potential increase to 5.75%, and the markets are facing a new reality. It feels like they're returning to the period before the global financial crisis of 2008-2009. Back then, the S&P 500 traded significantly below current levels, and the yield on 10-year U.S. Treasury bonds exceeded 5%.
Dynamics of real yields on U.S. Treasury bonds


The rally in debt market rates to the highest levels in more than a decade and the correction in U.S. stock indices create an unfavorable environment for risky assets. Bitcoin is still considered among them.
Technically, on the BTC/USD daily chart, there was a breakout of the lower boundary of the narrowing wedge. Although in technical analysis it is customary to relate it to a trend continuation model, a successful support assault is a reason to sell. The recommendation to increase previously formed short positions in case of a test of the 28,900 level proved successful. Now the best course of action is to hold the shorts. The targets are 25,000 and 23,300.
The material has been provided by InstaForex Company - www.instaforex.comfrom Forex analysis review https://ift.tt/s9doWYO
via IFTTT
