

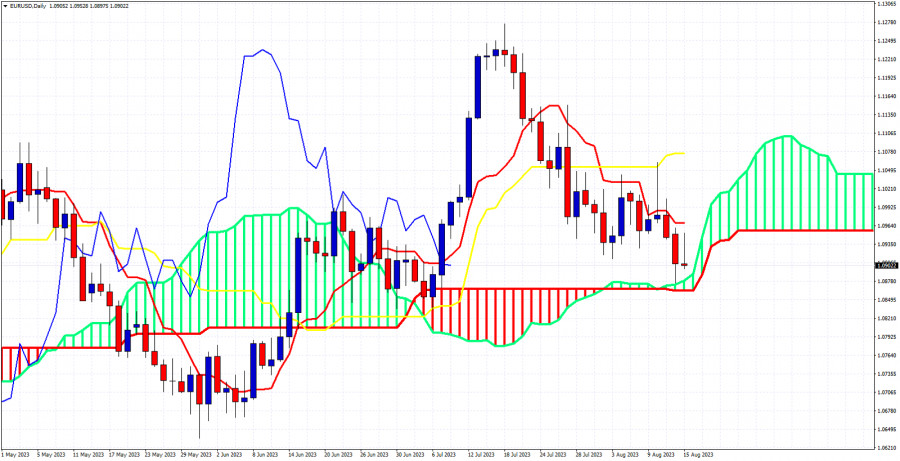
EURUSD is trading around 1.09. EURUSD is again under pressure. According to the Ichimoku cloud indicator in the Daily chart trend is still bullish, but over the last week we have warned several times traders that price is vulnerable to a move lower towards 1.09 and lower. The Chikou span (blue line indicator) is crossing below the candlestick pattern (bearish). Price is testing cloud support at 1.09-1.0870. Price is below the tenkan-sen (red line indicator) and the kijun-sen (yellow line indicator). The first bearish signal came in the 4 hour chart when price broke below the Kumo. In the Daily chart the first sign of weakness was when price broke below the tenkan-sen. Then the second sign came when it broke below the kijun-sen and the third signal was when the tenkan-sen crossed the kijun-sen. Today we get a new sign of weakness with the Chikou span crossing below the candlestick pattern. If price breaks below the Kumo we will get a trend reversal signal to bearish.
The material has been provided by InstaForex Company - www.instaforex.comfrom Forex analysis review https://ift.tt/KmEs3h9
via IFTTT