

Analyzing Monday's trades:
EUR/USD on 30M chart
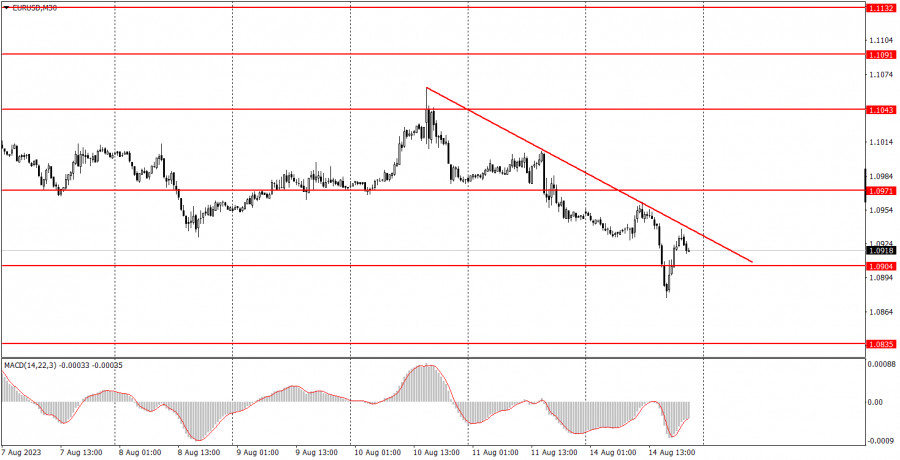
On Monday, EUR/USD continued to show weakness, a trend that began at the end of the previous week after two reports on U.S. inflation. On Thursday, inflation and core inflation reports were released, and on Friday, there was the producer price index, which is a derivative indicator of inflation. All three indices (except the core one) ticked higher, which increases the chances of additional tightening for the Federal Reserve in September. Therefore, the dollar began to rise again, although it had been flat for the previous two weeks.
No significant economic reports in the European Union or the U.S. Hence, there wasn't much for traders to react to, but the pair traded quite actively, which is unusual for "empty Mondays". Nevertheless, this movement made it possible for us to form a downward trend line. It's weak and short-term, but it's better than nothing.
EUR/USD on 5M chart
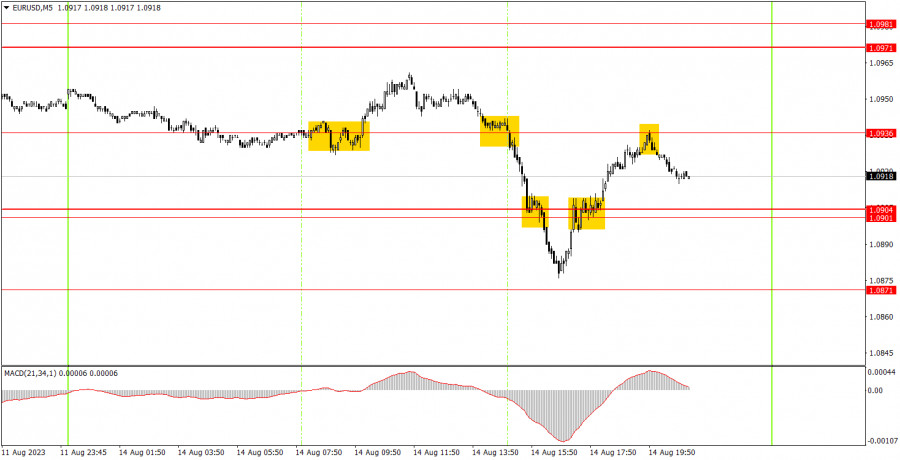
Quite a few trading signals on the 5-minute chart. Initially, the pair overcame the 1.0936 level, but only managed to rise by a mere 15 points, just enough to set a break-even Stop Loss. Then, a more interesting sell signal appeared around the same level, afterwards the pair almost reached the 1.0871 level, falling short by only a couple of points. Unfortunately, the short position had to be closed at the nearest buy signal, which formed around 1.0901-1.0904. Based on this signal, you could also open long positions with 1.0936 as the target, which the pair reached. In the end, three positions were opened, two of which were profitable. The total profit was around 30 points.
Trading tips on Tuesday:
On the 30M chart, the pair accelerated its decline, and may continue to fall, which, in our opinion, is still the most justified and logical course of events. We don't see any macroeconomic background that would be capable of drastically changing market sentiment this week. The key levels on the 5M chart are 1.0761, 1.0835, 1.0871, 1.0901-1.0904, 1.0936, 1.0971-1.0981, 1.1011, 1.1043, 1.1091, 1.1132-1.1145, 1.1184, 1.1241. A stop loss can be set at a breakeven point as soon as the price moves 15 pips in the right direction. On Tuesday, the EU will release the ZEW economic sentiment indices (including for Germany), while the US will release its retail sales report. These are secondary reports, and the market will probably have a mild reaction towards them.
Basic trading rules:
1) The strength of the signal depends on the time period during which the signal was formed (a rebound or a break). The shorter this period, the stronger the signal.
2) If two or more trades were opened at some level following false signals, i.e. those signals that did not lead the price to Take Profit level or the nearest target levels, then any consequent signals near this level should be ignored.
3) During the flat trend, any currency pair may form a lot of false signals or do not produce any signals at all. In any case, the flat trend is not the best condition for trading.
4) Trades are opened in the time period between the beginning of the European session and until the middle of the American one when all deals should be closed manually.
5) We can pay attention to the MACD signals in the 30M time frame only if there is good volatility and a definite trend confirmed by a trend line or a trend channel.
6) If two key levels are too close to each other (about 5-15 pips), then this is a support or resistance area.
How to read charts:
Support and Resistance price levels can serve as targets when buying or selling. You can place Take Profit levels near them.
Red lines are channels or trend lines that display the current trend and show which direction is better to trade.
MACD indicator (14,22,3) is a histogram and a signal line showing when it is better to enter the market when they cross. This indicator is better to be used in combination with trend channels or trend lines.
Important speeches and reports that are always reflected in the economic calendars can greatly influence the movement of a currency pair. Therefore, during such events, it is recommended to trade as carefully as possible or exit the market in order to avoid a sharp price reversal against the previous movement.
Beginners should remember that every trade cannot be profitable. The development of a reliable strategy and money management are the key to success in trading over a long period of time.
The material has been provided by InstaForex Company - www.instaforex.comfrom Forex analysis review https://ift.tt/L35VQj2
via IFTTT