

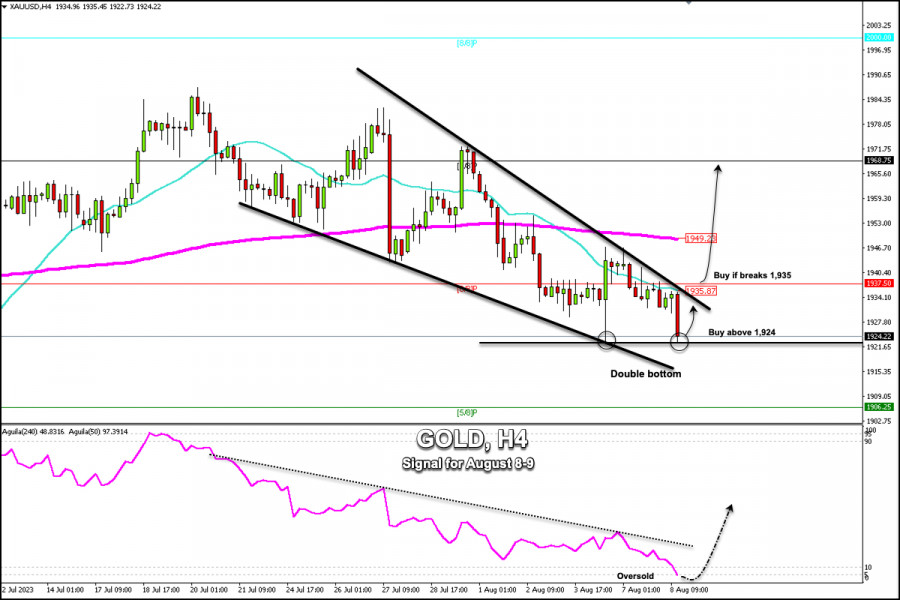
Early in the American session, gold is trading around 1,924, below the 21 SMA found at 1,935 and below the 200 SMA of 1,949.
On the 4-hour chart, we can see the formation of a double bottom pattern around 1,922. In the event that gold rebounds above this level, it could be a sign of a bullish move that could be capped below 6/8 Murray at 1,937.
Additionally, we can observe the formation of a symmetrical triangle in which a sharp break above 1,935 and above 1,937 (6/8 Murray) could be a clear signal to buy, with targets at 1,949 and 1,968.
Conversely, in case XAU/USD falls below 1,920 we could expect a bearish acceleration and this could reach 5/8 Murray located around 1,906.
On a fundamental level, fears from China, one of the main consumers of gold, could also exert downward pressure on XAU/USD.
Another factor that could put pressure on gold is the US inflation data due on August 10th. If the data is below the consensus of 3.3%, it could support the recovery of gold.
There is one last hope for gold to rally, only if it trades above 1,921. If this scenario occurs it could reach 1,968 and even up to the psychological level of $2,000.
The material has been provided by InstaForex Company - www.instaforex.comfrom Forex analysis review https://ift.tt/3EYJ4Np
via IFTTT