Analysis of Monday trades:
EUR/USD 30M chart

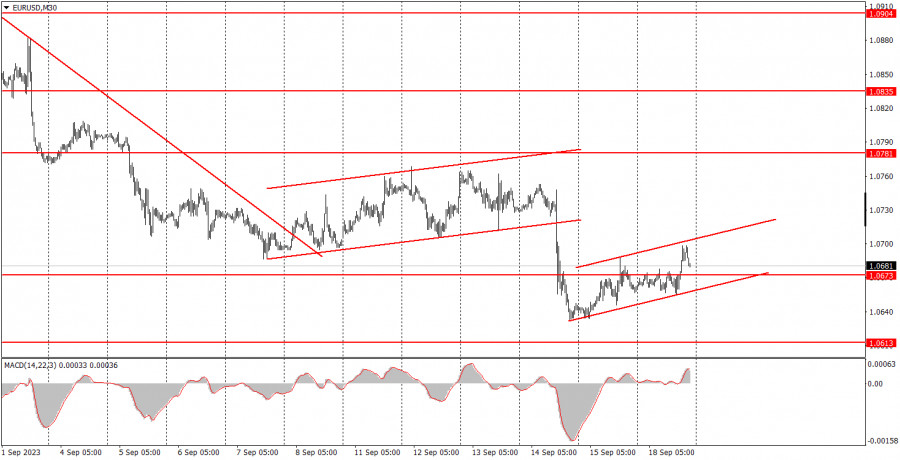
The EUR/USD currency pair showcased a mere 45-point volatility on Monday, a fact we've been consistently highlighting in our reports. For one, if we're drawing attention to it, it's clearly an area of concern - the volatility is notably weak. Secondly, such low volatility makes trading this pair challenging and, quite frankly, often pointless. A 40-point movement in one direction isn't too concerning by itself, but this typically represents a flat, directionless market. The bottom line? Low volatility combined with flat trading. What's the rationale behind trading in such a scenario?
As illustrated in recent charts, the past few weeks have witnessed tepid, corrective movements. Sandwiched between two upward channels is the previous Thursday's European Central Bank (ECB) meeting and the subsequent plunge of the European currency. Barring that, volatility rarely exceeded the 50-55 point mark. Today, neither the US nor the European Union had any significant events to report. Additionally, Luis de Guindos's address failed to provide any fresh insights.
EUR/USD 5M chart

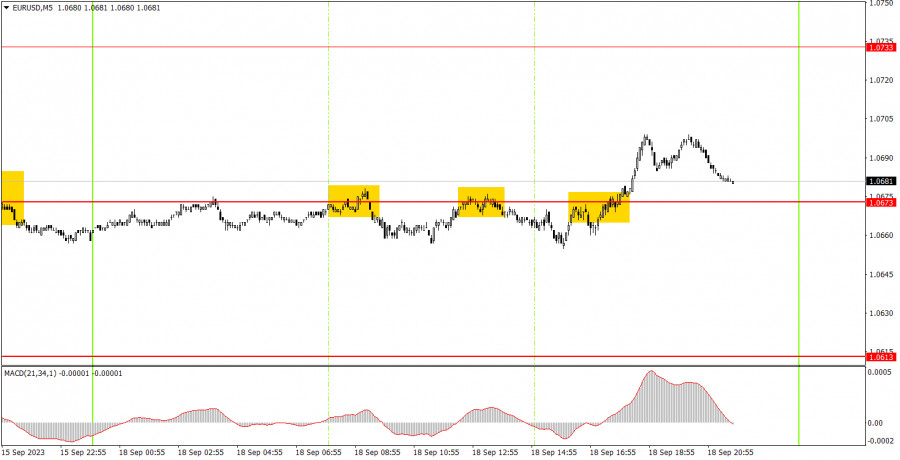
The 5-minute chart clearly showcases the intraday flat pattern we touched upon earlier. Indeed, there was a slight uptick in activity around mid-US trading session, but even accounting for this flurry, volatility capped at 45 points. The day presented three trading signals. Twice, the price bounced off the 1.0673 level from below and once it broke through. In the first two instances, the price couldn't muster even a 15-point movement in the anticipated direction, while in the last case, it managed to achieve that tiny milestone. The initial short trade likely ended in a modest loss, with the subsequent long trade possibly registering a slight profit.
Trading idea for Tuesday:
The 30-minute chart indicates the onset of a faint correction. The European currency, however, still lacks strong bullish catalysts. In a medium-term outlook, we anticipate the euro's downward trajectory regardless of the macroeconomic and fundamental backdrop. On the 5-minute timeframe, traders should eye the following levels tomorrow: 1.0517-1.0533, 1.0607-1.0613, 1.0673, 1.0733, 1.0767-1.0781, 1.0835, 1.0871, and 1.0901-1.0904. If a 15-point movement in the intended direction materializes, setting a break-even Stop Loss could be considered. On Tuesday, the European Union is set to release its second inflation estimate for August, while the US will unveil its building permits figures. Both reports are secondary in importance. While inflation is always a key indicator, its second assessment doesn't quite hold the same weight. We don't foresee any significant uptick in volatility for Tuesday.
Basic rules of a trading system:
1) Signal strength is determined by the time taken for its formation (either a bounce or level breach). A shorter formation time indicates a stronger signal.
2) If two or more trades around a certain level are initiated based on false signals, subsequent signals from that level should be disregarded.
3) In a flat market, any currency pair can produce multiple false signals or none at all. In any case, the flat trend is not the best condition for trading.
4) Trading activities are confined between the onset of the European session and mid-way through the U.S. session, post which all open trades should be manually closed.
5) On the 30-minute timeframe, trades based on MACD signals are only advisable amidst substantial volatility and an established trend, confirmed either by a trend line or trend channel.
6) If two levels lie closely together (ranging from 5 to 15 pips apart), they should be considered as a support or resistance zone.
How to read charts:
Support and Resistance price levels can serve as targets when buying or selling. You can place Take Profit levels near them.
Red lines represent channels or trend lines, depicting the current market trend and indicating the preferable trading direction.
The MACD(14,22,3) indicator, encompassing both the histogram and signal line, acts as an auxiliary tool and can also be used as a signal source.
Significant speeches and reports (always noted in the news calendar) can profoundly influence the price dynamics. Hence, trading during their release calls for heightened caution. It may be reasonable to exit the market to prevent abrupt price reversals against the prevailing trend.
Beginning traders should always remember that not every trade will yield profit. Establishing a clear strategy coupled with sound money management is the cornerstone of sustained trading success.
The material has been provided by InstaForex Company - www.instaforex.comfrom Forex analysis review https://ift.tt/Z7ClWKY
via IFTTT
