

Analyzing Thursday's trades:
GBP/USD on 30M chart
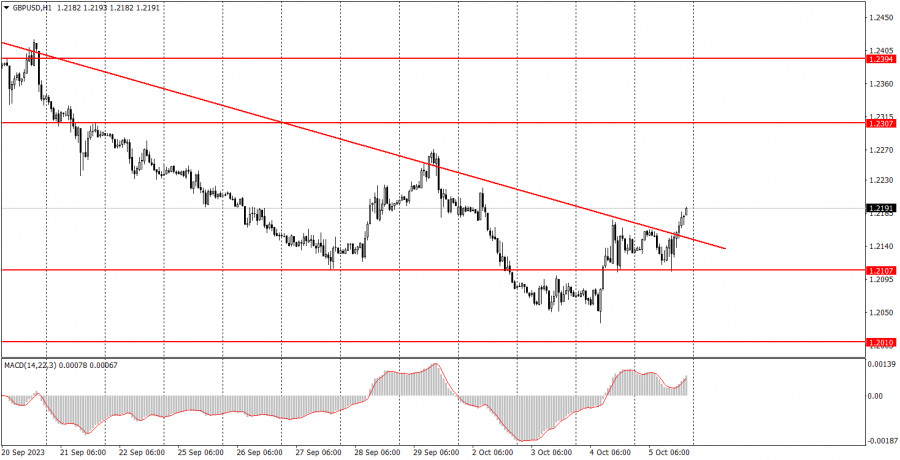
On Thursday, GBPUSD also continued its bullish correction, but volatility was very weak, and the pair remained stagnant for most of the day. There were hardly any economic reports, and even fewer significant fundamental events. In the past year, every statement by the central bank governor was quite significant because the market didn't understand to what extent each central bank would raise interest rates. Now, the situation is more or less clear, so attention to rate hikes have also waned. Bank of England Governor Andrew Bailey delivered a speech regarding inflation but did not make any bold statements. The only notable economic report was the US Initial Jobless Claims, which almost matched expectations.
GBP/USD on 5M chart
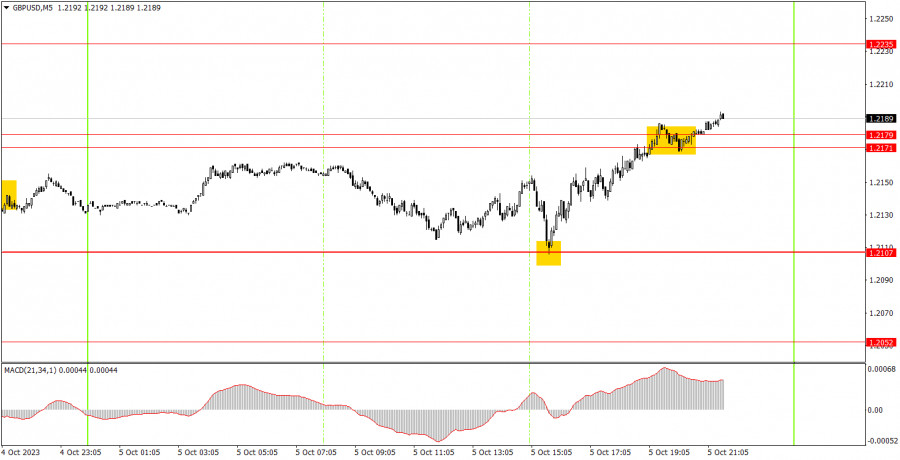
There were two trading signals on the 5-minute chart, and traders could not execute one of them. At the beginning of the US session, the price bounced from the level of 1.2107, after that it rose to the range of 1.2171-1.2179 and even surpassed it. Beginners should have executed this strong and clear buy signal, which allowed for a profit of about 60 pips.
Trading tips on Friday:
On the 30-minute chart, GBP/USD concluded its correction swiftly and promptly began a new leg, which has lasted for two days now. The upward movement can continue even without specific daily fundamental and macroeconomic bases. A decline in the medium-term perspective is anticipated regardless, given the pound's prolonged and unjustified rise, but a correction now seems more logical. The key levels on the 5M chart are 1.1992-1.2010, 1.2052, 1.2107, 1.2171-1.2179, 1.2235, 1.2307, 1.2372-1.2394, 1.2457-1.2488, 1.2544, 1.2605-1.2620, 1.2653, 1.2688. Once the price moves 20 pips in the right direction after opening a trade, you can set the stop-loss at breakeven. There are no interesting events lined up for the UK. On the other hand, the US will release reports on Non-Farm Payrolls and the Unemployment Rate. These are influential data. Therefore, strong movements and sharp reversals are possible in the second half of the day.
Basic trading rules:
1) The strength of the signal depends on the time period during which the signal was formed (a rebound or a break). The shorter this period, the stronger the signal.
2) If two or more trades were opened at some level following false signals, i.e. those signals that did not lead the price to Take Profit level or the nearest target levels, then any consequent signals near this level should be ignored.
3) During the flat trend, any currency pair may form a lot of false signals or do not produce any signals at all. In any case, the flat trend is not the best condition for trading.
4) Trades are opened in the time period between the beginning of the European session and until the middle of the American one when all deals should be closed manually.
5) We can pay attention to the MACD signals in the 30M time frame only if there is good volatility and a definite trend confirmed by a trend line or a trend channel.
6) If two key levels are too close to each other (about 5-15 pips), then this is a support or resistance area.
How to read charts:
Support and Resistance price levels can serve as targets when buying or selling. You can place Take Profit levels near them.
Red lines are channels or trend lines that display the current trend and show which direction is better to trade.
MACD indicator (14,22,3) is a histogram and a signal line showing when it is better to enter the market when they cross. This indicator is better to be used in combination with trend channels or trend lines.
Important speeches and reports that are always reflected in the economic calendars can greatly influence the movement of a currency pair. Therefore, during such events, it is recommended to trade as carefully as possible or exit the market in order to avoid a sharp price reversal against the previous movement.
Beginners should remember that every trade cannot be profitable. The development of a reliable strategy and money management are the key to success in trading over a long period of time.
The material has been provided by InstaForex Company - www.instaforex.comfrom Forex analysis review https://ift.tt/RX4pLAO
via IFTTT