

Analyzing Wednesday's trades:
EUR/USD on 30M chart
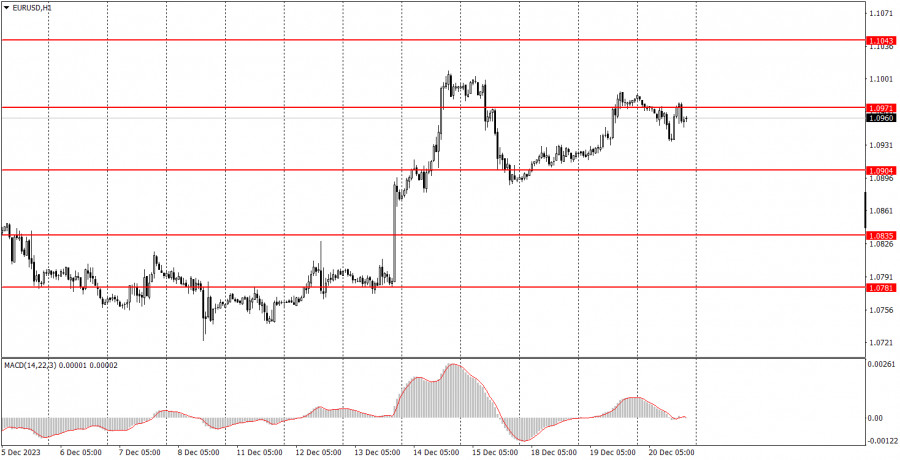
EUR/USD exhibited a flat phase on Wednesday. Initially, the pair slightly fell, then increased a bit, and the overall volatility of the day did not exceed 50 pips. Therefore, Wednesday turned out to be a very uneventful day. Besides the lack of movements, there was also an absence of fundamental and macroeconomic background. Therefore, traders had nothing to react to during the day. At the beginning of the US trading session, there was a small spike in emotions, but it quickly faded away. So the technical picture did not change. The pair still remains near its local highs, maintaining the chances of an unwarranted rise.
As we have repeatedly mentioned, the euro has no basis to rise further. The market continues to buy the euro but is not inclined to buy the dollar, even when there are reasons to do so. This is an illogical market reaction. We believe that the factors from last week, which caused a significant decline in the dollar, have already been worked out and can no longer provide support for the euro.
EUR/USD on 5M chart
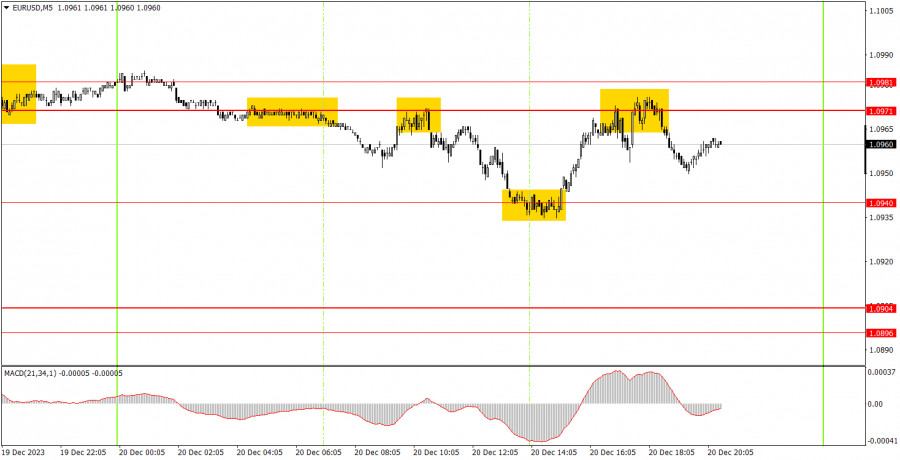
On the 5-minute chart, we can see how obvious the flat was. The price spent the entire day between the levels of 1.0940 and 1.0971, within a 30-pip range. However, surprisingly, trading signals around these levels were quite clear, and they could be worked out. Naturally, high profits were not discussed since volatility was very low. Nevertheless, by trading each rebound during the day, beginners could earn around 30-40 pips, which is not bad for this kind of day.
Trading tips on Thursday:
On the hourly chart, EUR/USD maintains an uptrend. However, if last week, traders had good reasons to buy the euro, this week there are none, but the euro is still rising. We believe that the euro does not have enough reasons to rise further. Last week, the growth was supported by the fundamental background, but it will no longer receive the same support this week.
On Thursday, we suggest that you use the area of 1.0971-1.0981 as a reference point. If the pair rebounds from it, we can expect the pair to fall and use 1.0940 and 1.0904 as targets. If there is a breakthrough, the pair may continue to rise with targets at 1.1011 and 1.1043.
The key levels on the 5M chart are 1.0611-1.0618, 1.0668, 1.0733, 1.0767-1.0781, 1.0835, 1.0896-1.0904, 1.0940, 1.0971-1.0981, 1.1011, 1.1043, 1.1091, 1.1132-1.1145. On Thursday, there are no interesting events lined up in the European Union. The US docket will feature the third estimate of the Q3 GDP report and unemployment claims. Most likely, the market will hardly react to these reports, so we may expect another boring day.
Basic trading rules:
1) Signal strength is determined by the time taken for its formation (either a bounce or level breach). A shorter formation time indicates a stronger signal.
2) If two or more trades around a certain level are initiated based on false signals, subsequent signals from that level should be disregarded.
3) In a flat market, any currency pair can produce multiple false signals or none at all. In any case, the flat trend is not the best condition for trading.
4) Trading activities are confined between the onset of the European session and mid-way through the U.S. session, post which all open trades should be manually closed.
5) On the 30-minute timeframe, trades based on MACD signals are only advisable amidst substantial volatility and an established trend, confirmed either by a trend line or trend channel.
6) If two levels lie closely together (ranging from 5 to 15 pips apart), they should be considered as a support or resistance zone.
How to read charts:
Support and Resistance price levels can serve as targets when buying or selling. You can place Take Profit levels near them.
Red lines represent channels or trend lines, depicting the current market trend and indicating the preferable trading direction.
The MACD(14,22,3) indicator, encompassing both the histogram and signal line, acts as an auxiliary tool and can also be used as a signal source.
Significant speeches and reports (always noted in the news calendar) can profoundly influence the price dynamics. Hence, trading during their release calls for heightened caution. It may be reasonable to exit the market to prevent abrupt price reversals against the prevailing trend.
Beginning traders should always remember that not every trade will yield profit. Establishing a clear strategy coupled with sound money management is the cornerstone of sustained trading success.
The material has been provided by InstaForex Company - www.instaforex.comfrom Forex analysis review https://ift.tt/pTf8UNe
via IFTTT