

Analyzing Wednesday's trades:
EUR/USD on 30M chart
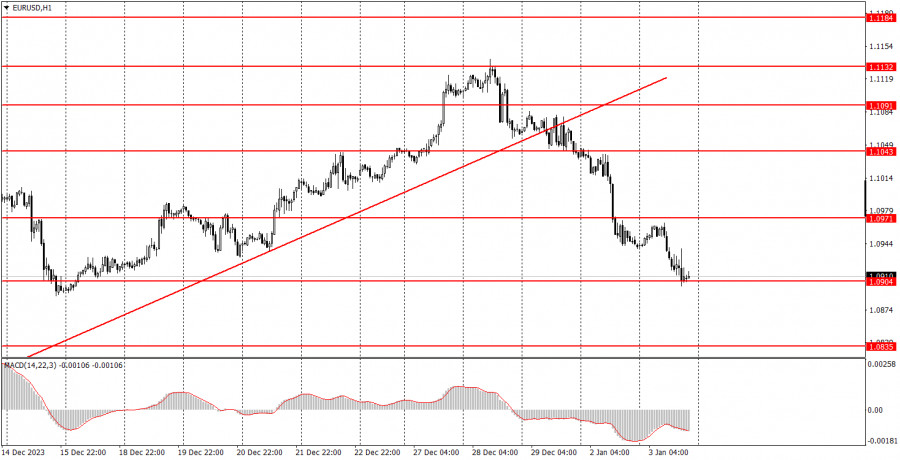
EUR/USD continued to trade lower throughout Wednesday and ended the day near the level of 1.0904. In principle, we didn't even see a minor correction after the three-day decline, but that's not a big deal. We've repeatedly mentioned that the euro was overbought, and we expected the decline several weeks ago. The decline didn't start for various reasons - sometimes macroeconomic conditions got in the way, sometimes it was the fundamental background, and sometimes the market simply refused to sell the pair, despite almost all factors favoring it. However, the euro couldn't keep rising forever either. The price eventually settled below the trendline, and we saw the first signs of a trend reversal. Currently, this trend is still forming, and no one said that the decline should be gradual and weak.
As for important US economic reports, their values were so precise that they had no impact on market sentiment. The JOLTs and ISM reports almost entirely matched the forecasted values, so we didn't see any market reaction.
EUR/USD on 5M chart
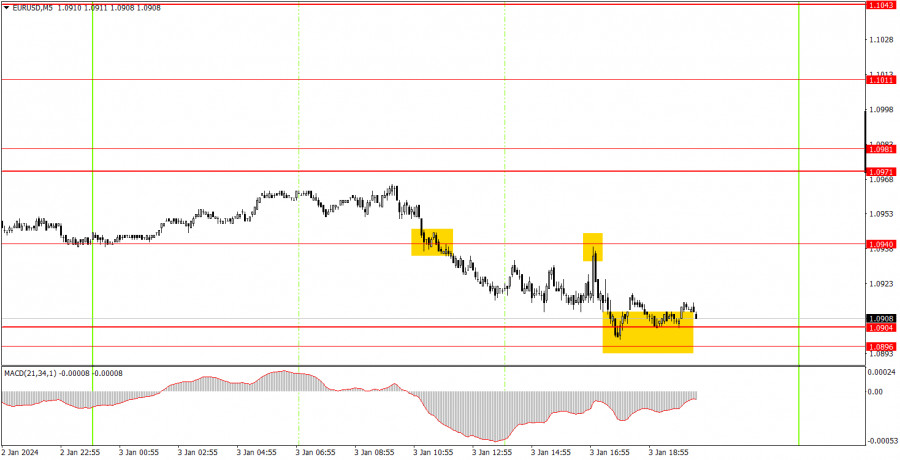
On the 5-minute chart, two trading signals were generated. First, the pair broke through the level of 1.0940 and then bounced off it from below. In the first case, the pair failed to reach the target level of 1.0904 but fell enough for you to set a breakeven stop loss of 15 pips. Therefore, there was no loss or profit on the first short position. In the second case, the pair reached the level of 1.0904, and you could close shorts around it. The profit was approximately 20 pips.
Trading tips on Thursday:
On the hourly chart, EUR/USD finally has a chance to form a downtrend. Of course, the decline may be less significant than in the past two days, but the trend has started. The US will release important reports that can still affect the dollar's exchange rate. This means that the pair could potentially show some growth this week.
On Thursday, we will focus on the range of 1.0896-1.0904. The pair has not overcome it yet, so we may observe an upward retracement. It is unlikely to be strong, but you can try to work it out using 1.0940 as a target. If the price surpasses this range, it will be a reason for new short positions with 1.0835 as the target.
The key levels on the 5M chart are 1.0733, 1.0767-1.0781, 1.0835, 1,0896-1,0904, 1.0940, 1.0971-1.0981, 1.1011, 1.1043, 1.1091, 1.1132-1.1145, 1.1184, 1.1241, 1.1279-1.1292. In Germany, the eurozone, and the United States, December data on the index of business activity in the services sector from the S&P will be published. These are secondary data. Germany will also release inflation data for December. From the US docket, the ADP report and unemployment claims data. These are more important data.
Basic trading rules:
1) Signal strength is determined by the time taken for its formation (either a bounce or level breach). A shorter formation time indicates a stronger signal.
2) If two or more trades around a certain level are initiated based on false signals, subsequent signals from that level should be disregarded.
3) In a flat market, any currency pair can produce multiple false signals or none at all. In any case, the flat trend is not the best condition for trading.
4) Trading activities are confined between the onset of the European session and mid-way through the U.S. session, post which all open trades should be manually closed.
5) On the 30-minute timeframe, trades based on MACD signals are only advisable amidst substantial volatility and an established trend, confirmed either by a trend line or trend channel.
6) If two levels lie closely together (ranging from 5 to 15 pips apart), they should be considered as a support or resistance zone.
How to read charts:
Support and Resistance price levels can serve as targets when buying or selling. You can place Take Profit levels near them.
Red lines represent channels or trend lines, depicting the current market trend and indicating the preferable trading direction.
The MACD(14,22,3) indicator, encompassing both the histogram and signal line, acts as an auxiliary tool and can also be used as a signal source.
Significant speeches and reports (always noted in the news calendar) can profoundly influence the price dynamics. Hence, trading during their release calls for heightened caution. It may be reasonable to exit the market to prevent abrupt price reversals against the prevailing trend.
Beginning traders should always remember that not every trade will yield profit. Establishing a clear strategy coupled with sound money management is the cornerstone of sustained trading success.
The material has been provided by InstaForex Company - www.instaforex.comfrom Forex analysis review https://ift.tt/xBkz6cV
via IFTTT