

Analyzing Tuesday's trades:
GBP/USD on 1H chart
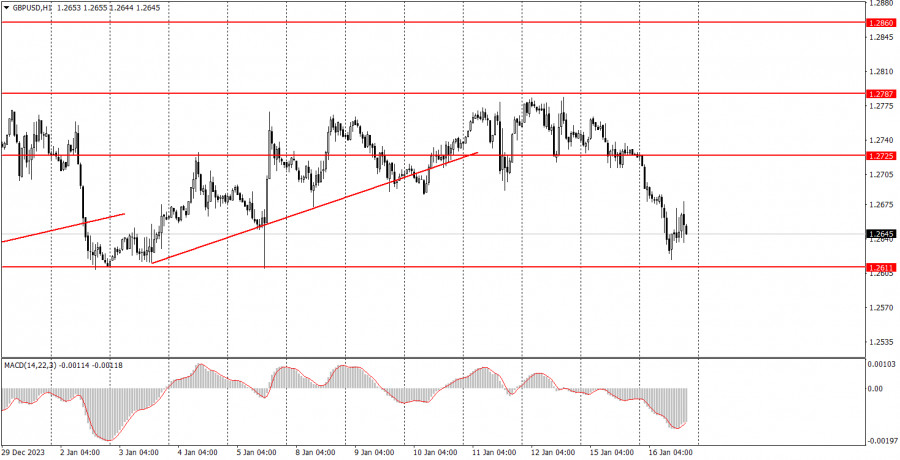
The GBP/USD pair showed a downward movement during the second trading day of the week. By the end of the day, the pair was around the level of 1.2611, so now the further movement of the British currency depends on whether it can break through or not surpass this level. Recall that for the last three weeks, the price has been in a sideways channel, the lower boundary of which is right around the level of 1.2611. Therefore, there is a high probability of a rebound from this support and a new round of upward movement within the sideways channel.
Several quite important reports were published in the UK, including the unemployment rate, unemployment benefit claims, and wage growth rates. Two out of three reports were not in favor of the pound sterling, while the third was neutral. Nevertheless, the fall of the pound started long before these reports were published, so the British statistics had almost no impact on the traders' sentiment.
Remember, the British pound remains overbought and unjustifiably expensive relative to the dollar. Thus, we continue to expect a strong fall from it. However, as long as the price does not consolidate below the level of 1.2611, from which it has already bounced several times, there will be no downward trend. The market is still skeptical about the dollar.
GBP/USD on 5M chart
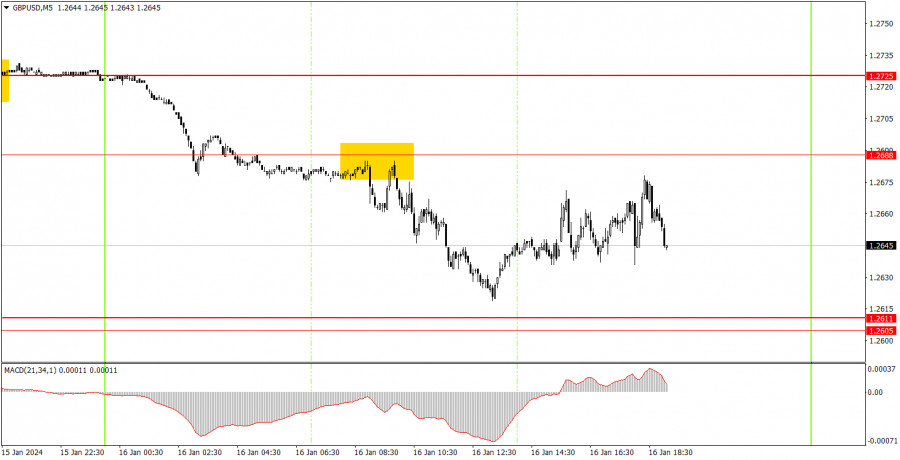
Only one trading signal was formed on the 5-minute timeframe on Tuesday. At the beginning of the European trading session, the price bounced twice from the level of 1.2688 with a minimal error, which could be neglected. Unfortunately, the price didn't reach the target level of 1.2611 by just 7 points.
Trading tips on Wednesday:
On the hourly timeframe, the GBP/USD pair has finally started a downward movement, but it is still within the sideways channel of 1.2611–1.2787. So now, not a downward trend has started, but the sideways movement continues. By today, the price may once again unsuccessfully try to consolidate below 1.2611, after which a new round of growth within the flat, which is clearly visible on the 4-hour timeframe, will begin.
Everything will depend on the area of 1.2606–1.2611, which acts as the lower boundary of the sideways channel, in which the pound has been for almost a month. If there is a rebound from this area, we will again consider long positions with the first target of 1.2688. If the pair consolidates below this area, then we will consider selling with the target of 1.2544.
The key levels on the 5M chart are 1.2270, 1.2310, 1.2372-1.2387, 1.2457, 1.2502,
1.2544, 1.2605-1.2611, 1.2688, 1.2725, 1.2787-1.2791, 1.2848-1.2860, 1.2913, 1.2981-1.2993.
An important report on inflation in the UK for December will be published, which could greatly influence market sentiment. In America, only a couple of secondary reports are due, to which much less attention will be paid.
Basic trading rules:
- Signal strength is determined by the time taken for its formation (either a bounce or level breach). A shorter formation time indicates a stronger signal.
- If two or more trades around a certain level are initiated based on false signals, subsequent signals from that level should be disregarded.
- In a flat market, any currency pair can produce multiple false signals or none at all. In any case, the flat trend is not the best condition for trading.
- Trading activities are confined between the onset of the European session and mid-way through the U.S. session, after which all open trades should be manually closed.
- On the 30-minute timeframe, trades based on MACD signals are only advisable amidst substantial volatility and an established trend, confirmed either by a trendline or trend channel.
- If two levels lie closely together (ranging from 5 to 15 pips apart), they should be considered as a support or resistance zone.
- When the price moves in the correct direction by 20 pips after opening a trade, a Stop Loss should be set to break even.
How to read charts:
Support and Resistance price levels can serve as targets when buying or selling. You can place Take Profit levels near them.
Red lines represent channels or trend lines, depicting the current market trend and indicating the preferable trading direction.
The MACD(14,22,3) indicator, encompassing both the histogram and signal line, acts as an auxiliary tool and can also be used as a signal source.
Significant speeches and reports (always noted in the news calendar) can profoundly influence the price dynamics. Hence, trading during their release calls for heightened caution. It may be reasonable to exit the market to prevent abrupt price reversals against the prevailing trend.
Beginners should always remember that not every trade will yield profit. Establishing a clear strategy coupled with sound money management is the cornerstone of sustained trading success.
The material has been provided by InstaForex Company - www.instaforex.comfrom Forex analysis review https://ift.tt/E0oeZun
via IFTTT