

It seems that there is something more attractive in 2024 than U.S. stocks. They have been growing for 14 out of the last 15 weeks, a trend not seen since 1972. The S&P 500 has marked its 11th record since the beginning of the year, closing in the upper part of the trading range in 71% of sessions. This is the strongest performance in the last four decades. However, the leader in the cryptocurrency sector shines so brightly that no stock indices can compare with it.
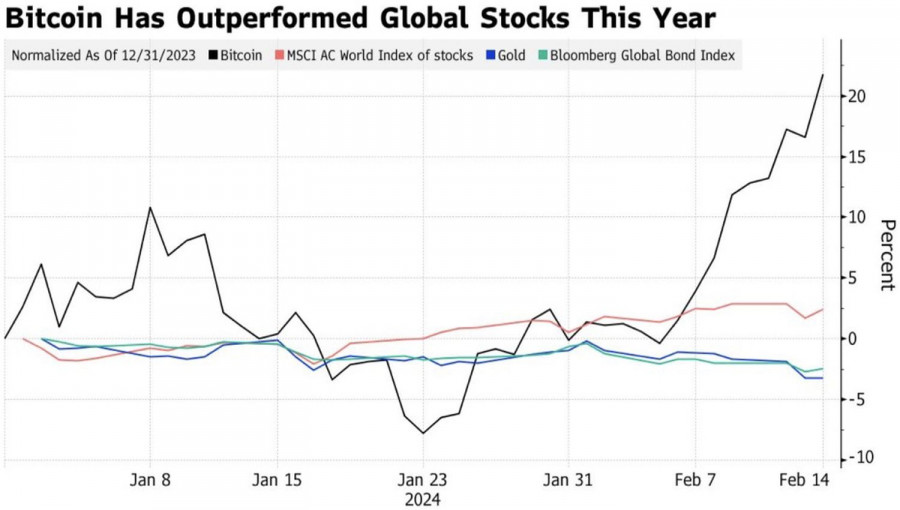
Bitcoin's rally above 50,000 for the first time since December 2021 brought its market capitalization back to the $1 trillion level. According to CoinGecko, the market value of all crypto assets has exceeded $2 trillion, a feat not achieved since April 2022. Digital currencies have no competitors, and the success of traditional assets such as global stocks, gold, and bonds pales in comparison to BTC/USD.
Dynamics of Bitcoin and other assets
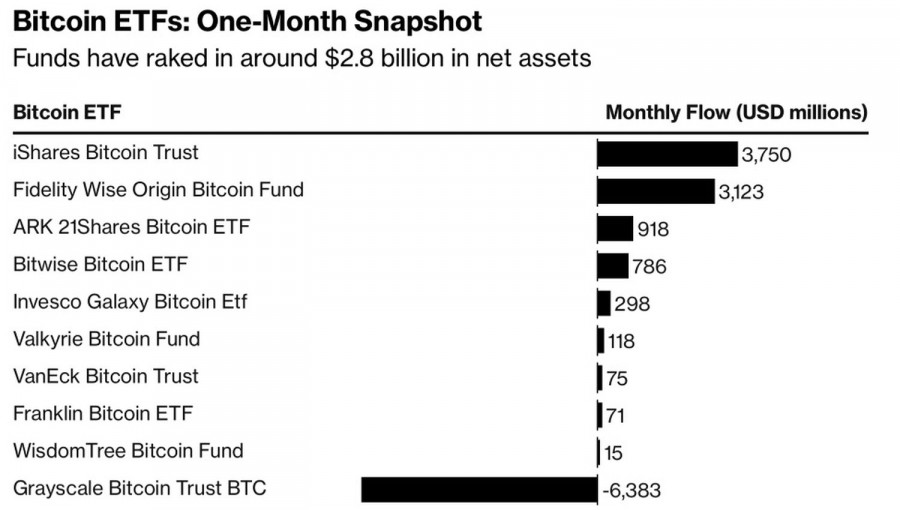
The main drivers of Bitcoin's rally are capital inflows into newly formed spot ETFs and the upcoming halving in April. In the market, a fund that attracts $100 million per month is considered successful. In this regard, almost all of the 11 SEC-approved specialized exchange-traded funds with the cryptocurrency sector leader as the underlying asset are basking in glory.
In total, they have attracted around $10 billion on a gross basis and $2.8 billion on a net basis. Some of the money came from ETFs where bitcoin futures were the underlying asset.
Capital inflows into ETFs with bitcoin as the underlying asset
As a result, after a 20% drop due to the "buy the rumor, sell the fact" principle of SEC approval for new financial market institutions, capital inflows allowed BTC/USD to soar above 52,000. The correlation between ETF demand and the cryptocurrency's value has risen to 0.87. There is an opinion that it will increase even more, as the limited supply allows liquidity to be the main driver of price formation.
Bitcoin retreated along with U.S. stock indices after the release of inflation data in the U.S. for January. Its resilience made investors abandon the idea of a Federal Reserve rate cut in March, worsening global risk appetite. However, the devil turned out not to be as bad as he was painted. After the rapid recovery of the S&P 500 and the cryptocurrency sector leader, there was nothing left for them to do but soar to the skies. Disappointing statistics on U.S. retail sales provided the first signal of a slowdown in the U.S. economy.
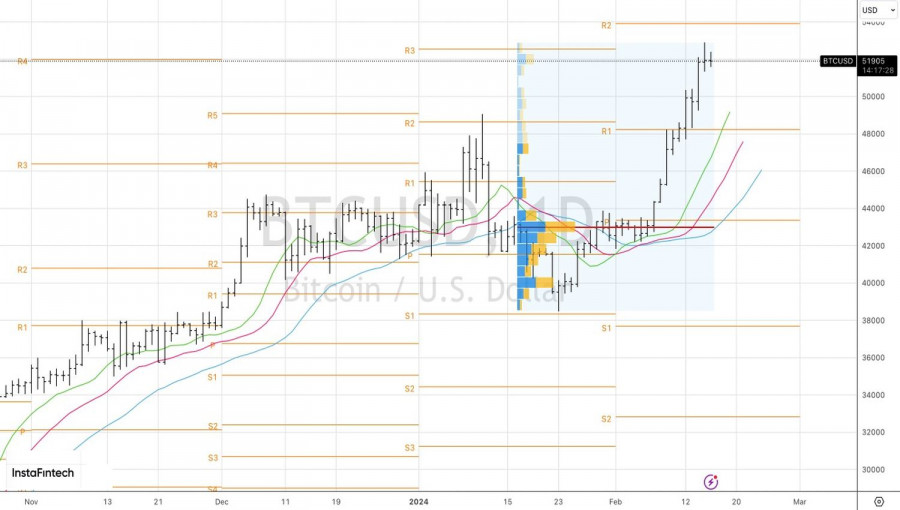
Technically, on the daily chart of BTC/USD, there is no doubt about the sustainability of the upward trend. Quotes are increasingly moving away from dynamic supports in the form of moving averages, indicating the dominance of the bulls. The target set in the previous material at 49,100 for longs was easily achieved. However, if the bears manage to play out a pin bar, a breakthrough of its base near 51,300 could be a reason for short-term sales.
The material has been provided by InstaForex Company - www.instaforex.comfrom Forex analysis review https://ift.tt/8kq2VJW
via IFTTT