

Analysis of EUR/USD 5M
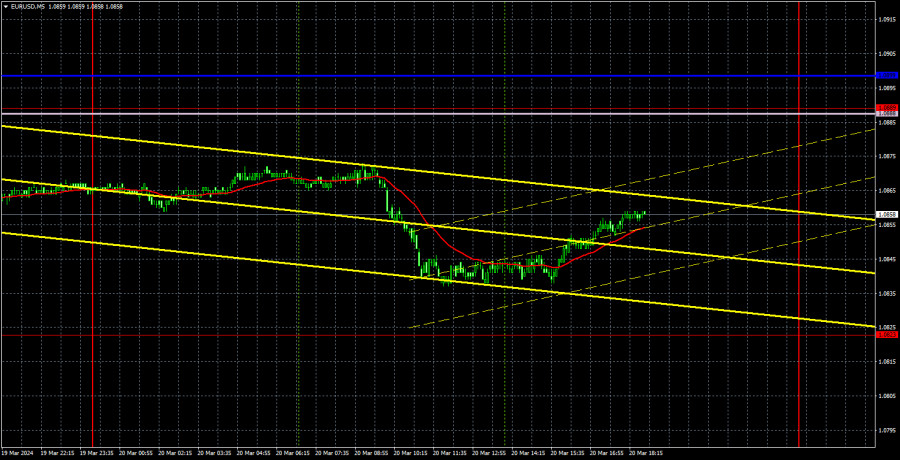
EUR/USD maintained a downward trend on Wednesday, but once again the pair showed very weak volatility and movement. We will not consider the movements after the results of the Federal Reserve meeting. The market traded impulsively, and it will take some time for it to calm down. Movements after Fed meetings should not even be considered in the overall technical analysis, as they often deviate from the general picture. Therefore, we will conduct an analysis of the Fed meeting tonight.
Yesterday, there was no volatility. The euro fell after European Central Bank President Christine Lagarde's speech, in which she said that the current disinflationary process is at work, but again, we are talking about just a few tens of pips, no more. The price is significantly below the trendline, but the trendline itself has a very small slope. Let's put it this way: the downtrend remains intact, but it is very weak, just like all movements in recent weeks and even months.
Speaking of trading signals, like in the past few days, there were none. This is not surprising given how low volatility was. Therefore, according to our trading system, traders should not have entered the market on Wednesday.
In general, the fundamental and macroeconomic background works in favor of the US dollar regardless of the results of the Fed meeting. Therefore, we expect the pair to fall.
COT report:
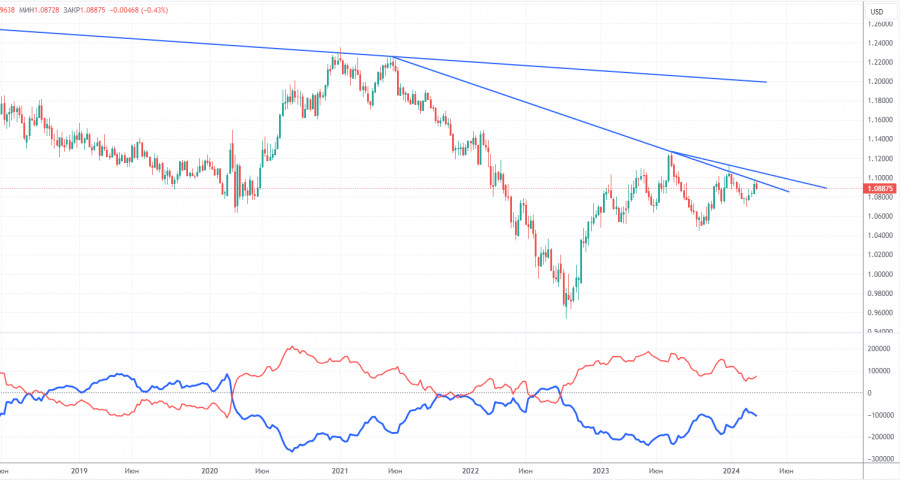
The latest COT report is dated March 12. The net position of non-commercial traders has been bullish for quite some time. Basically, the number of long positions in the market is higher than the number of short positions. However, at the same time, the net position of non-commercial traders has been decreasing in recent months, while that of commercial traders has been increasing. This shows that market sentiment is turning bearish, as speculators are increasing the volume of short positions on the euro. We don't see any fundamental factors that can support the euro's growth in the long term, while technical analysis also suggests a downtrend. Three descending trend lines on the weekly chart indicate that there's a good chance of extending the decline.
At present, the red and blue lines are moving towards each other (indicating a trend reversal after a rise). Therefore, we believe that the euro will fall further. During the last reporting week, the number of long positions for the non-commercial group decreased by 6,000, while the number of short positions decreased by 14,100. Accordingly, the net position increased by 8,100. The number of buy contracts is still higher than the number of sell contracts among non-commercial traders by 74,000 (previously 66,000).
Analysis of EUR/USD 1H
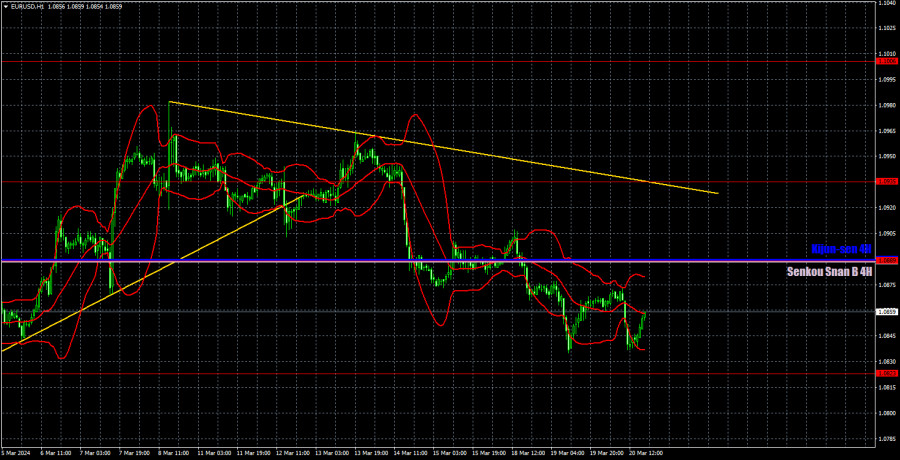
On the 1-hour chart, EUR/USD may initiate the long-awaited downtrend, which could take the price far down. The price has breached the Senkou Span B line, which means that we can expect the pair to fall further. The descending trendline also supports sellers. Despite the low volatility, the pair still managed to fall, which is encouraging because the dollar could have risen.
On March 21, we highlight the following levels for trading: 1.0530, 1.0581, 1.0658-1.0669, 1.0757, 1.0823, 1.0889, 1.0935, 1.1006, 1.1092, as well as the Senkou Span B line (1.0888) and the Kijun-sen (1.0891). The Ichimoku indicator lines can move during the day, so this should be taken into account when identifying trading signals. Don't forget to set a Stop Loss to breakeven if the price has moved in the intended direction by 15 pips. This will protect you against potential losses if the signal turns out to be false.
On Thursday, German, euro area, and the US Purchasing Managers Index (PMI) data will be released. Take note that the US has its "own" business activity indices – ISM. They are more significant and important, while the S&P indices are considered secondary. In any case, even if we pay attention to the euro area PMI data, what reaction can we expect given the current volatility? 20 pips? The US will also release secondary reports on unemployment claims and new home sales, but we don't expect these reports to move the market.
Description of the chart:
Support and resistance levels are thick red lines near which the trend may end. They do not provide trading signals;
The Kijun-sen and Senkou Span B lines are the lines of the Ichimoku indicator, plotted to the 1H timeframe from the 4H one. They provide trading signals;
Extreme levels are thin red lines from which the price bounced earlier. They provide trading signals;
Yellow lines are trend lines, trend channels, and any other technical patterns;
Indicator 1 on the COT charts is the net position size for each category of traders;
Indicator 2 on the COT charts is the net position size for the Non-commercial group.
The material has been provided by InstaForex Company - www.instaforex.comfrom Forex analysis review https://ift.tt/12fTrS3
via IFTTT