Analysis of EUR/USD 5M

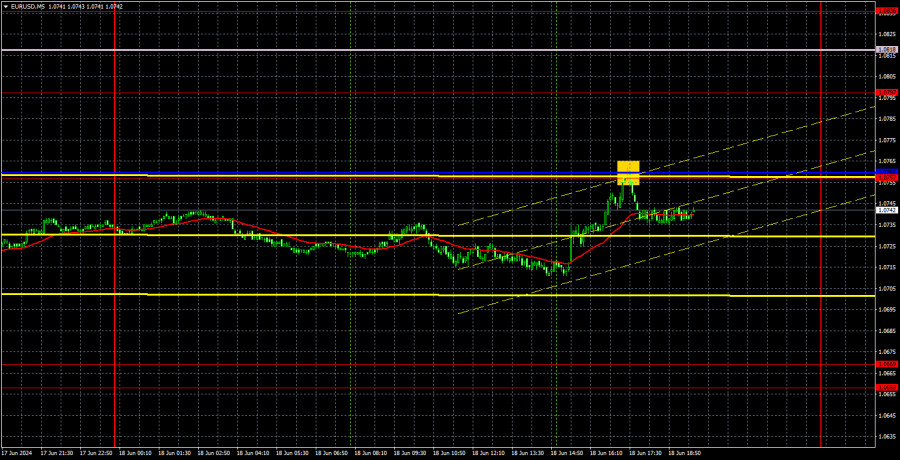
EUR/USD continued to trade higher on Tuesday. The movement is completely corrective in nature. By the end of the day, the price reached the critical line, and it immediately bounced back. Therefore, the euro may fall as early as today. Yesterday, the European Union published the final estimate of its inflation report for May. The market did not react to the report, as the second estimate fully matched the first. Moreover, the rise to 2.6% currently holds no negative consequences for the European Central Bank. The central bank has already lowered its rate, and we may not see another rate cut again before September. Therefore, if the inflation rate does increase in the coming months, this will not reduce the likelihood of the ECB slowing down the monetary policy easing. The indicator will have enough time until September to return to the 2.3-2.4% range.
The German ZEW Economic Sentiment Index turned out to be worse than expected. However, we already warned our readers that this report is of secondary importance, so the market did not react to this report either. Overall, the euro maintains the prospect of a prolonged and strong decline. We don't see any reason for forming an upward trend in the euro.
Only one trading signal was generated on the 5-minute timeframe. During the U.S. session, the price bounced off the Kijun-sen line, and this signal could have been used for a short position. The correction may not be over yet, but the signal is strong and accurate.
COT report:

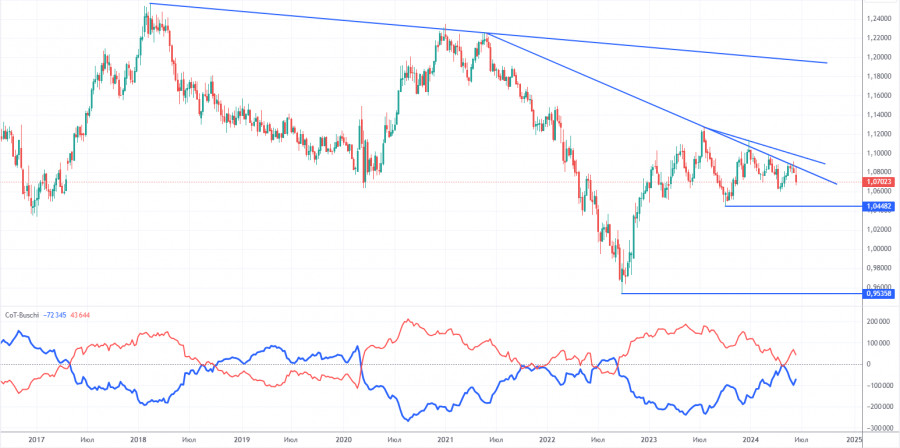
The latest COT report is dated June 11. The net position of non-commercial traders has remained bullish for a long time, and we're still dealing with the same situation. The bears' attempt to gain dominance failed miserably. The net position of non-commercial traders (red line) has been declining in recent months, while that of commercial traders (blue line) has been growing. But now we're seeing the opposite once again. This shows that buyers, not sellers, are currently gaining momentum again. This might be temporary since the downward trend is still valid.
We don't see any fundamental factors that can support the euro's strength in the long term, while technical analysis also suggests a continuation of the downtrend. Three descending trend lines on the weekly chart suggests that there's a good chance of further decline.
The red and blue lines are currently moving away from each other again, which indicates a build-up in long positions on the euro. During the last reporting week, the number of long positions for the non-commercial group decreased by 1,200, while the number of short positions increased by 23,000. Accordingly, the net position decreased by 14,200. We may witness the start of increasing bearish pressure. According to the COT reports, the euro has a lot of potential to fall.
Analysis of EUR/USD 1H

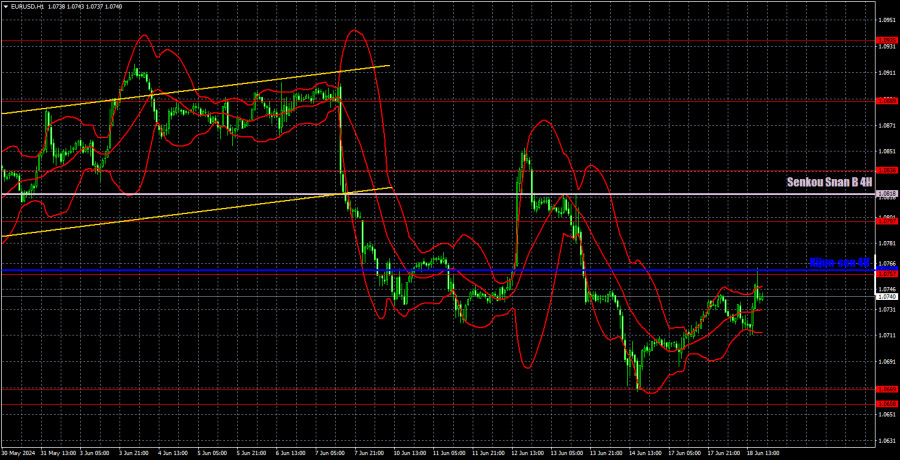
On the 1-hour chart, EUR/USD finally started to form a new downward trend, which is part of the global trend. As previously mentioned, we still expect the single currency to fall. At this time, the pair is going through a technical correction. We don't expect the euro to fall every day. Most likely, the downward movement will be gradual. This is the nature of EUR/USD trading.
On June 19, we highlight the following levels for trading: 1.0530, 1.0581, 1.0658-1.0669, 1.0757, 1.0797, 1.0836, 1.0889, 1.0935, 1.1006, 1.1092, as well as the Senkou Span B line (1.0818) and the Kijun-sen line (1.0760). The Ichimoku indicator lines can move during the day, so this should be taken into account when identifying trading signals. Don't forget to set a Stop Loss to breakeven if the price has moved in the intended direction by 15 pips. This will protect you against potential losses if the signal turns out to be false.
On Wednesday, there is nothing to highlight in the economic calendars of the euro area and the United States. EUR/USD may go through significantly low volatility throughout the day. The pair may continue to trade lower after bouncing off the critical line, but at most, it might show a movement of about 30 pips. However, perhaps the UK inflation report can push EUR/USD to become more active?
Description of the chart:
Support and resistance levels are thick red lines near which the trend may end. They do not provide trading signals;
The Kijun-sen and Senkou Span B lines are the lines of the Ichimoku indicator, plotted to the 1H timeframe from the 4H one. They provide trading signals;
Extreme levels are thin red lines from which the price bounced earlier. They provide trading signals;
Yellow lines are trend lines, trend channels, and any other technical patterns;
Indicator 1 on the COT charts is the net position size for each category of traders;
The material has been provided by InstaForex Company - www.instaforex.comfrom Forex analysis review https://ift.tt/F2XPIg0
via IFTTT
