Analysis of GBP/USD 5M

The GBP/USD pair traded higher again on Thursday. Yes, the growth of the British currency cannot be called strong, but it still took place, and the price is now above the Ichimoku indicator lines. Thus, the downward trend ended almost as soon as it began, which we warned about at the beginning of the week. Even overcoming the trend line, which was forming for several weeks in a row, did not help the US currency. But what can the market do if almost all the US data leaves much to be desired?
We have already mentioned that the problem lies not even in the data but in the forecasts, which are often greatly overstated. However, what difference does it make? The market trades the way it trades. If it is satisfied with working on values that do not meet the forecasts, then so be it. Unfortunately, the fundamental background does not play a special role at this time, as the Bank of England has already begun easing monetary policy, but this does not matter for the market.
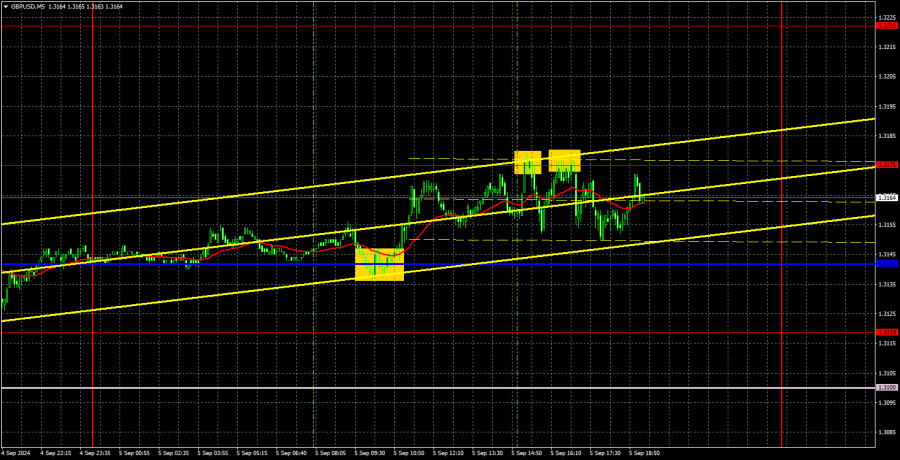
Despite very weak volatility, which arose due to a relatively strong macroeconomic background, the trading signals during the past day were quite good. First, the pair bounced off the critical Kijun-sen line, then rose to the 1.3175 level and bounced off it twice. Thus, traders could open a long position in the first case, which should have been closed near the 1.3175 level. In the second case, it was possible to open a short position, but it was not possible to profit from it, as the price returned twice to the 1.3175 level without working out the nearest target—the Kijun-sen line. Given the weak volatility, a profit of about 20 pips is also not bad.
COT report:

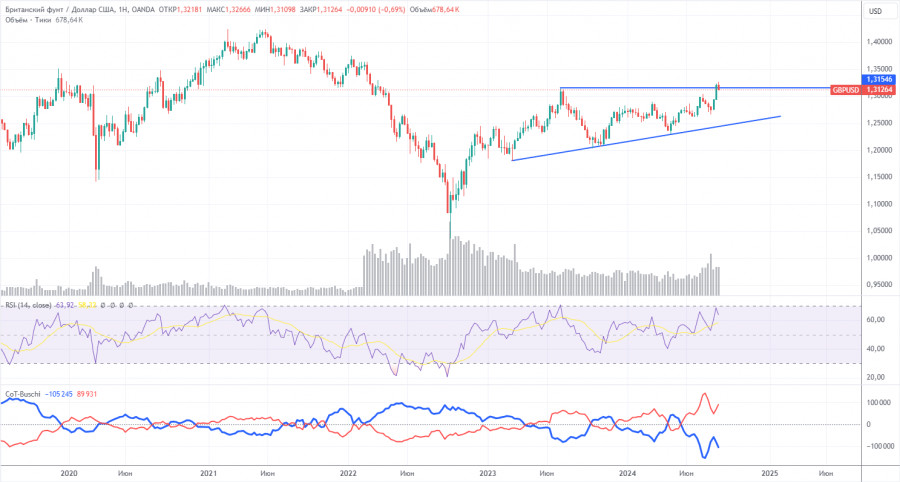
The COT reports for the British pound indicate that the sentiment of commercial traders has been subject to frequent changes in recent years. The red and blue lines, representing the net positions of commercial and non-commercial traders, are constantly intersecting and often close to the zero mark. We also see that the last downward trend occurred when the red line was below zero. Therefore, a downturn could be expected around the level of 1.3154, but this assumption will need regular confirmation over time.
According to the latest report on the British pound, the non-commercial group opened 26,500 buy contracts and 4,100 short ones. As a result, the net position of non-commercial traders increased by 22,400 contracts over the week, but overall, it is still rising rather than falling.
The fundamental background still does not provide any grounds for long-term purchases of the pound sterling, and the currency has a real chance to resume the global downward trend. However, an ascending trend line formed in the weekly time frame. Therefore, a long-term decline in the pound is unlikely unless the price breaches this trend line. Despite almost everything, the pound continues to rise. Even when COT reports show that major players are selling the pound, it continues to rise.
Analysis of GBP/USD 1H

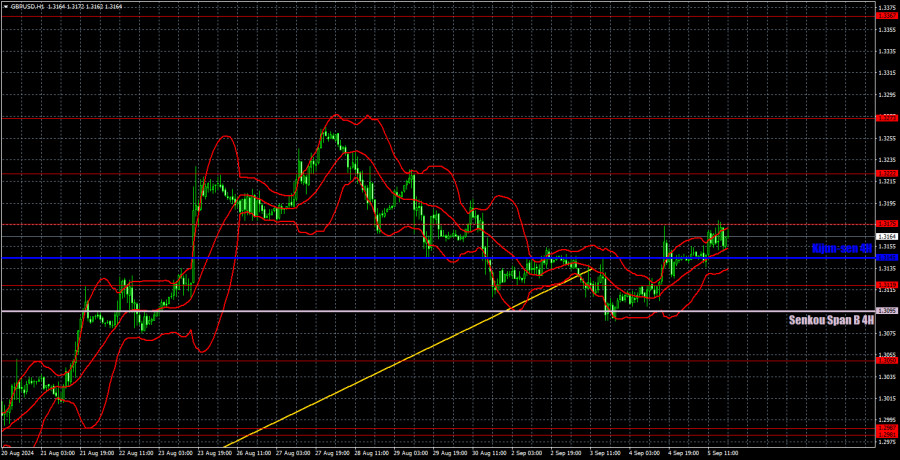
In the hourly time frame, GBP/USD continues to correct, but this correction could end at any moment. It may have ended since the price failed to consolidate below the Senkou Span B line. Most of the macroeconomic data in the US this week have been weak as usual, and nothing good is expected for the dollar today. The pair has corrected, but so far, it has not been able to start a new downtrend.
For September 6, we highlight the following important levels: 1.2605-1.2620, 1.2691-1.2701, 1.2796-1.2816, 1.2863, 1.2981-1.2987, 1.3050, 1.3119, 1.3175, 1.3222, 1.3273, 1.3367. The Senkou Span B (1.3095) and Kijun-sen (1.3145) lines can also serve as sources of signals. Setting the Stop Loss to break even when the price moves in the intended direction by 20 pips is recommended. The Ichimoku indicator lines may shift during the day, which should be considered when determining trading signals.
No interesting events are scheduled in the UK on Friday. However, super-important reports like NonFarm Payrolls and unemployment will be published in the US. The fate of the US dollar this week depends on these reports. So far, everything points to a complete breakdown. In any case, any downward movement above the Senkou Span B line is just a correction.
Explanation of illustrations:
Support and resistance levels: Thick red lines near which the trend may end.
Kijun-sen and Senkou Span B lines: These Ichimoku indicator lines, transferred from the 4-hour timeframe to the hourly chart, are strong lines.
Extreme levels: Thin red lines from which the price previously bounced. These provide trading signals.
Yellow lines: Trend lines, trend channels, and other technical patterns.
Indicator 1 on COT charts: The net position size for each category of traders.
The material has been provided by InstaForex Company - www.instaforex.comfrom Forex analysis review https://ift.tt/oHQPfJ2
via IFTTT
