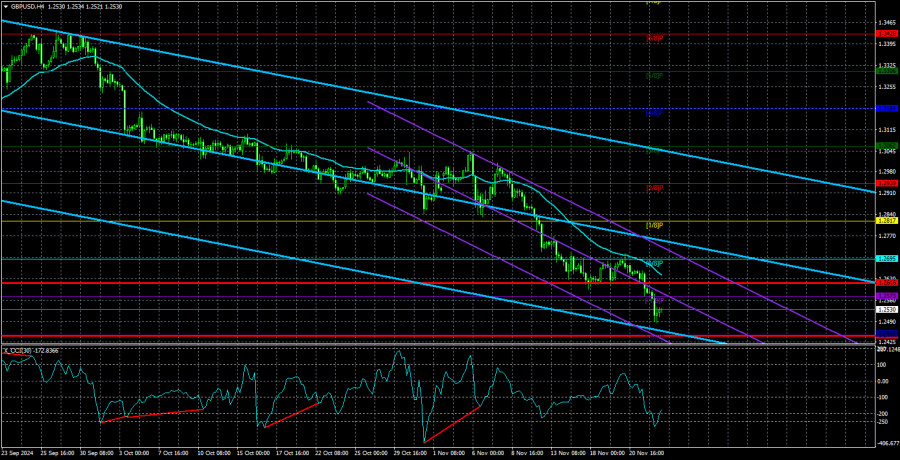
The GBP/USD currency pair continued its downward movement on Friday. What traders observe on the charts is still a relatively optimistic scenario for the British currency. It's worth noting that, given its volatility, the pound is falling less sharply than the euro. Over the last two months, the euro has dropped by 700–800 pips, while the pound has declined by 800–900 pips. However, the pound typically exhibits 1.5 times more volatility than the euro. Thus, under normal circumstances, the pound could have lost 1,100–1,200 pips over the same period.
That said, the pound is demonstrating stronger resistance against the US dollar. This resilience may be partly attributed to the Bank of England's monetary policy, which appears to be slightly slowing the currency's decline. The BoE is in no rush to lower the key interest rate. However, it is almost certain that it will continue reducing the rate eventually. A high rate is unsustainable for the UK economy, which has stagnated for the past two years. Simply put, economic growth and acceleration are unlikely unless rates begin to drop. Meanwhile, the market has only been pricing in the Federal Reserve's rate cuts over the past two years. As a result, the pound has significant room for further depreciation.
The UK calendar does not contain major events or speeches. However, this does not mean that the pound will stop falling. The week also saw very few factors supporting further declines for the pound, yet the currency continued its slide even on days with no macroeconomic or fundamental developments.
In the US, notable events include the PCE Price Index, the second estimate of Q3 GDP, and the Durable Goods Orders report. However, these are not first-tier reports. The market rarely reacts immediately to GDP data. Though important for the Fed, the PCE index would need to significantly deviate from forecasts to provoke a reaction. Meanwhile, the Durable Goods Orders report is interesting but not critical.
The current market sentiment is driven by global factors, and ordinary macroeconomic reports are unlikely to shift it to a bullish stance. Over the past two months, the dollar has risen amid the Fed's monetary easing—a paradoxical phenomenon. However, we've repeatedly explained that the dollar had declined for two years in anticipation of the Fed's rate cuts. Therefore, much of the easing cycle had already been priced in, and the market is now adjusting the dollar to a fair value while factoring in previously ignored elements. These include the BoE's easing, the weakness of the British economy, and Donald Trump's return to power. As a result, we believe the pound can continue its downward trajectory without significant obstacles.

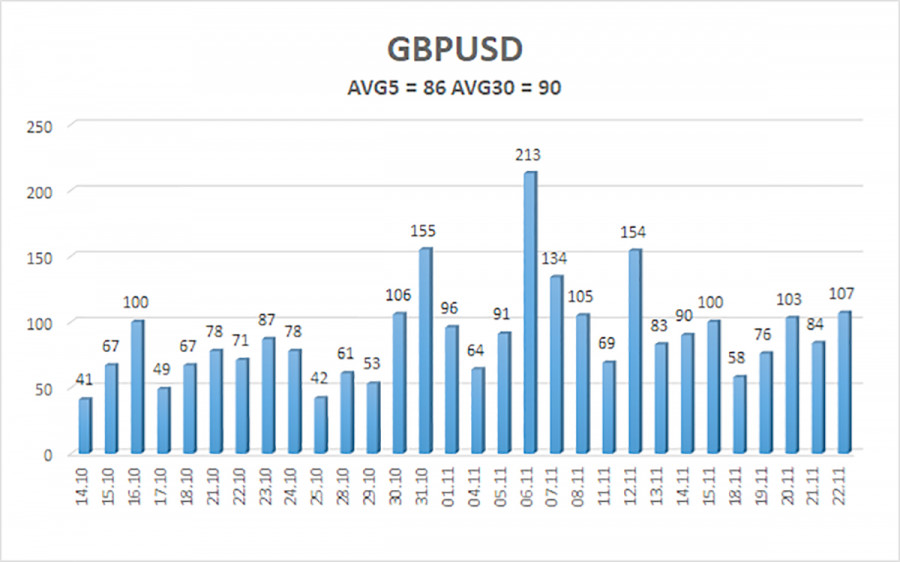
The average volatility for GBP/USD over the past five trading days is 86 pips, classified as "moderate." On Monday, November 25, we expect the pair to move within a range bounded by 1.2444 and 1.2616. The higher linear regression channel is downward, signaling a sustained bearish trend. The CCI indicator has formed multiple bullish divergences and entered the oversold zone several times, yet corrections remain elusive.
Key Support Levels:
- S1: 1.2451
Key Resistance Levels:
- R1: 1.2573
- R2: 1.2695
- R3: 1.2817
Trading Recommendations:
The GBP/USD pair maintains a bearish trend. We continue to rule out long positions, as we believe all potential growth factors for the pound have already been priced in multiple times. For traders relying on "pure technicals," long positions are possible with targets at 1.2817 and 1.2878, provided the price moves above the moving average. Short positions are more relevant, with a target of 1.2451, as long as the price remains below the moving average.
Explanation of Illustrations:
Linear Regression Channels help determine the current trend. If both channels are aligned, it indicates a strong trend.
Moving Average Line (settings: 20,0, smoothed) defines the short-term trend and guides the trading direction.
Murray Levels act as target levels for movements and corrections.
Volatility Levels (red lines) represent the likely price range for the pair over the next 24 hours based on current volatility readings.
CCI Indicator: If it enters the oversold region (below -250) or overbought region (above +250), it signals an impending trend reversal in the opposite direction.
The material has been provided by InstaForex Company - www.instaforex.comfrom Forex analysis review https://ift.tt/BqKYHgO
via IFTTT
