EUR/USD 5-Minute Analysis

On Wednesday, the EUR/USD pair continued its decline. Even skeptics of our market hypotheses and forecasts might now see that the market is rebalancing the pair, bringing it closer to its fair value. Recall that the market pushed the euro upward and the dollar downward for two years, driven solely by expectations of future monetary policy easing by the Federal Reserve. We warned that after September 18, the dollar could begin a strong and prolonged rally. As we can see, since September 18, the dollar has been rising continuously—even on days when it should logically fall. For example, yesterday's decline was entirely illogical. The day's only macroeconomic report—U.S. inflation—met expectations, which should have, at minimum, avoided provoking further dollar gains. Moreover, given that the dollar had been rising for several days leading up to the report, one might assume that the market had already priced in the inflation growth in the U.S.
But no. The dollar continued to rise simply because it had previously fallen too long and unjustifiably. We acknowledge that other factors influence the dollar's rate, such as Trump's factor, potential inflation under Trump, and the European Central Bank's monetary easing, which the market previously ignored. However, hardly anyone will deny that these factors conveniently align with the dollar's growth immediately after the Fed's first rate cut.
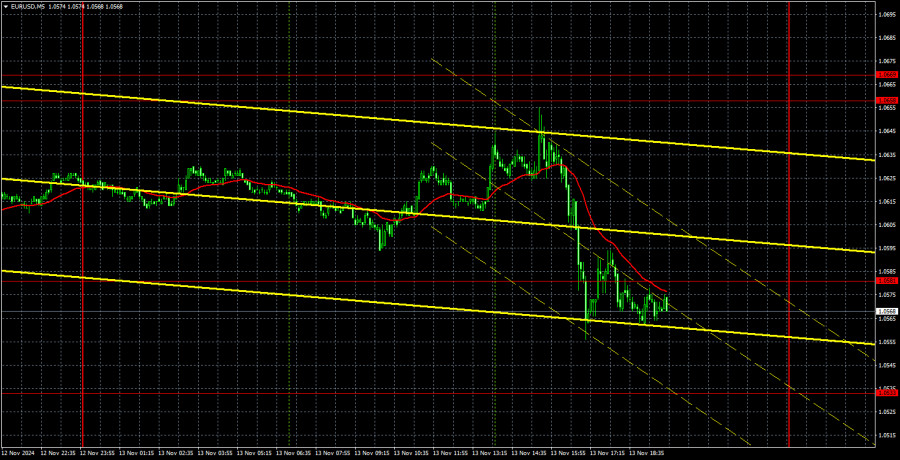
In the 5-minute time frame, the pair could have formed a perfect sell signal yesterday, but it missed the 1.0658 level by just three pips. Nonetheless, a sell signal was formed near this level, as we warned that the decline could continue even without a precise return to this level. A partial return occurred but wasn't exact. Subsequently, the price reached the nearest target and showed no inclination for a correction.
COT Report

The latest Commitments of Traders (COT) report is dated November 5. The net position of non-commercial traders has long remained bullish, with bears failing to gain dominance. However, three weeks ago, professional traders significantly increased their short positions, turning the net position negative for the first time in a long while. This indicates that the euro is now being sold more frequently than bought.
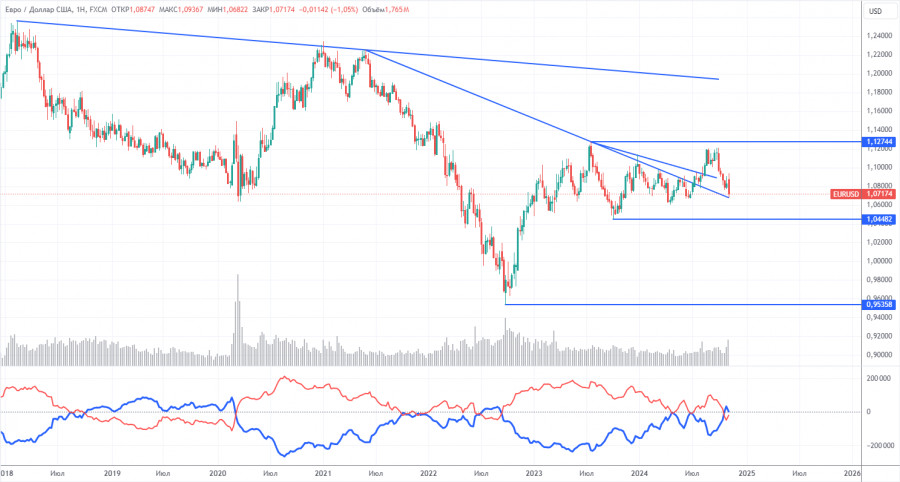
We still see no fundamental factors supporting the euro's strength, while technical analysis indicates consolidation—a flat market. On the weekly time frame, the pair has been trading between 1.0448 and 1.1274 since December 2022, effectively transitioning from a 7-month to a 20-month range. A move toward 1.0448 remains more likely.
Currently, the red and blue lines have crossed and reversed positions. Over the last reporting week, the number of long positions in the non-commercial group increased by 600, while short positions decreased by 28,000, resulting in a net drop of 27,400. The euro still has strong potential for further declines.
EUR/USD 1-Hour Analysis

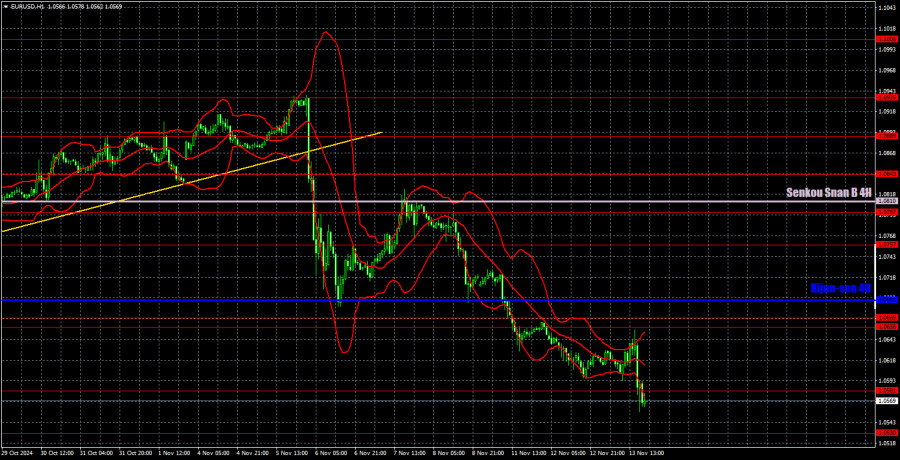
The pair continues forming a new downward trend on the hourly time frame. There's no point in discussing fundamental or macroeconomic reasons for the dollar's medium-term decline—they don't exist. In the medium term, we expect nothing but the euro's decline. Day by day, we become more convinced that the market has fully priced in the Fed's monetary easing cycle and is now factoring in other elements that all point in one direction: dollar growth.
For November 14, we highlight the following trading levels: 1.0485, 1.0533, 1.0581, 1.0658-1.0669, 1.0757, 1.0797, 1.0843, 1.0889, 1.0935, and 1.1006, as well as the Senkou Span B (1.0810) and Kijun-sen (1.0691) lines. The Ichimoku indicator lines may shift during the day, so consider this when identifying trading signals. Remember to set a Stop Loss to break even if the price moves 15 pips in your favor to protect against potential losses if the signal is false.
On Thursday, Fed Chair Jerome Powell is scheduled to speak in the U.S., while the Eurozone will release reports on Q3 GDP and industrial production. These are the most significant events of the day.
Chart Explanations:
Support and resistance levels: thick red lines around which movement may end. They are not sources of trading signals.
Kijun-sen and Senkou Span B lines: Ichimoku indicator lines transferred from the 4-hour to the 1-hour timeframe. These are strong lines.
Extreme levels: thin red lines where the price previously rebounded. They are sources of trading signals.
Yellow lines: Trend lines, trend channels, and other technical patterns.
Indicator 1 on COT charts: The net position size for each category of traders.
The material has been provided by InstaForex Company - www.instaforex.comfrom Forex analysis review https://ift.tt/LTQFIea
via IFTTT
