EUR/USD 5-Minute Analysis

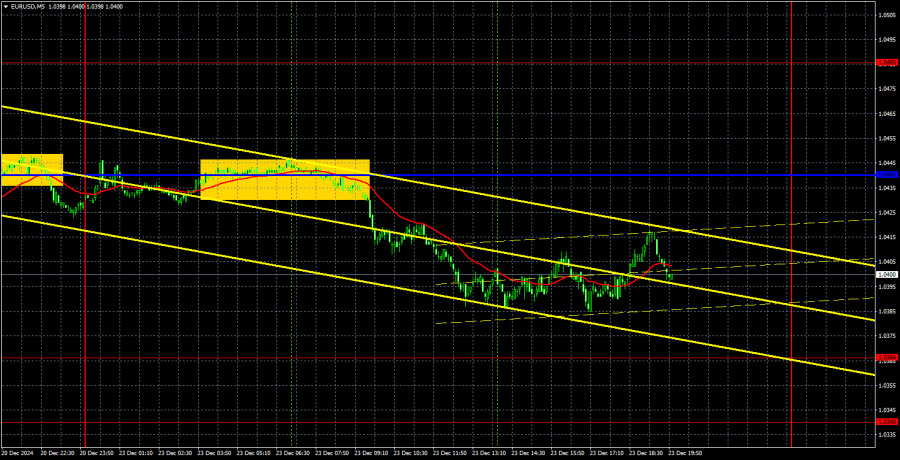
The EUR/USD currency pair experienced renewed declines on Monday, which aligns with our previous forecasts. In earlier articles, we highlighted that Friday's increase seemed illogical, as the macroeconomic conditions for that day did not support buying the euro. Furthermore, the outcomes of the European Central Bank and Federal Reserve meetings clearly indicated a downward trend. Therefore, Monday's decline was anticipated. Additionally, the price tested the Kijun-sen line and then rebounded, providing another signal for a downward reversal and selling opportunity. As a result, we expect the pair to approach the 1.0340-1.0366 range for the fourth time soon, a level that has thus far prevented the euro from declining further.
This week marks the start of the New Year holidays. Today is a shortened trading day, and tomorrow is a holiday. However, this does not mean the trading pairs will be inactive. In fact, we believe that in a thin market, bears might find it easier to break through the 1.0340-1.0366 range "under the radar." Overall, we continue to anticipate further declines in the EUR/USD pair.
From a trading signal perspective, the rebound from the Kijun-sen critical line, which triggered another wave of euro declines, stands out. This signal was quite precise, and given the bearish trend, it presented a clear trading opportunity. By the end of the day, the price nearly reached the 1.0340-1.0366 range. There is an 80% likelihood that this level will be tested soon.
COT Report

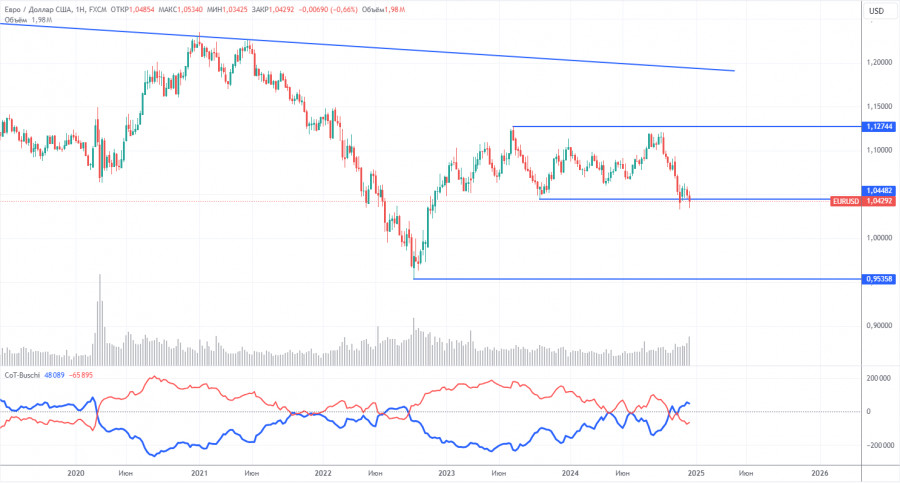
The latest Commitment of Traders (COT) report, dated December 17, shows a clear trend. The net position of non-commercial traders has remained bullish for a long time, but bears have gained the upper hand. Two months ago, the number of open short positions by professional traders surged, causing the net position to turn negative for the first time. This indicates that the euro is now sold more often than bought.
We continue to see no fundamental factors supporting the euro's growth, and technical analysis points to price consolidation — essentially, a flat market. On the weekly timeframe, it is evident that since December 2022, the pair has been trading within the 1.0448–1.1274 range. Therefore, further declines remain more likely. A break below 1.0448 would open new opportunities for a deeper fall.
The red and blue lines on the COT chart have crossed and changed their relative positions, signaling a bearish market trend. During the latest reporting week, the number of longs in the Non-commercial group decreased by 4,700, while shorts decreased by 14,400. As a result, the net position increased by almost 10,000, but this does not alter the overall bearish trend.
EUR/USD 1-Hour Analysis

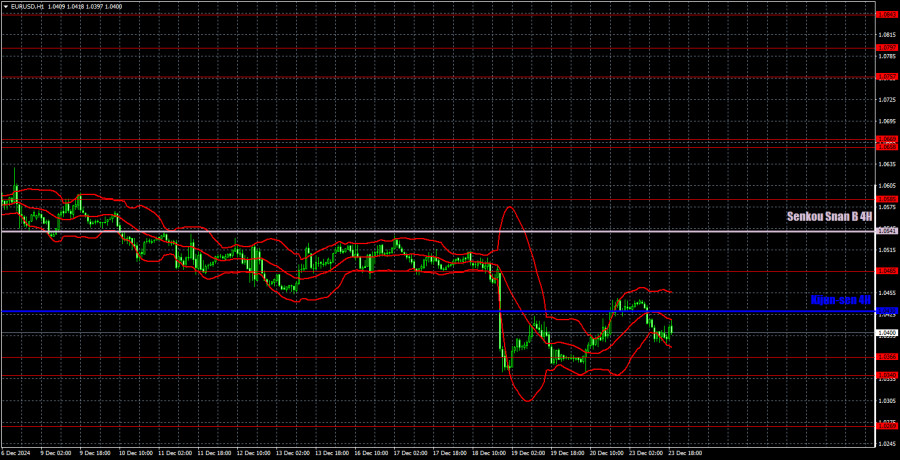
On the hourly timeframe, the currency pair has completed a three-week correction and has resumed its downward movement. We believe this decline may continue even during the holiday period due to the Fed's highly hawkish stance. The Fed is expected to lower rates only 1-2 times in 2025, which is a much more hawkish scenario than what the market has already priced in. We maintain that there are no solid grounds for significant growth of the euro. Additionally, the euro is approaching the 1.0340-1.0366 range for the fourth time.
For December 24, we highlight the following trading levels: 1.0195, 1.0269, 1.0340-1.0366, 1.0485, 1.0585, 1.0658-1.0669, 1.0757, 1.0797, 1.0843, and 1.0889. Additionally, keep an eye on the Senkou Span B at 1.0541 and the Kijun-sen at 1.0430. Please note that Ichimoku indicator lines may shift throughout the day, so traders should consider this when identifying trading signals. As always, set your Stop Loss to breakeven once the price moves 15 pips in the desired direction to protect against potential losses from false signals.
On Tuesday, the U.S. will release the Durable Goods Orders report, which is the most significant—and essentially the only—key data release this week. The market is likely to react to this report depending on how much the actual figures deviate from forecasts.
Illustration Explanations:
Support and Resistance Levels (thick red lines): Key areas where price movement might stall. Not sources of trading signals.
Kijun-sen and Senkou Span B Lines: Ichimoku indicator lines transferred from the H4 timeframe to the hourly chart, serving as strong levels.
Extreme Levels (thin red lines): Points where the price has previously rebounded. They can serve as trading signal sources.
Yellow Lines: Trendlines, channels, or other technical patterns.
Indicator 1 on COT Charts: Reflects the net position size of each trader category.
The material has been provided by InstaForex Company - www.instaforex.comfrom Forex analysis review https://ift.tt/Toqg9e6
via IFTTT
