GBP/USD 5-Minute Analysis

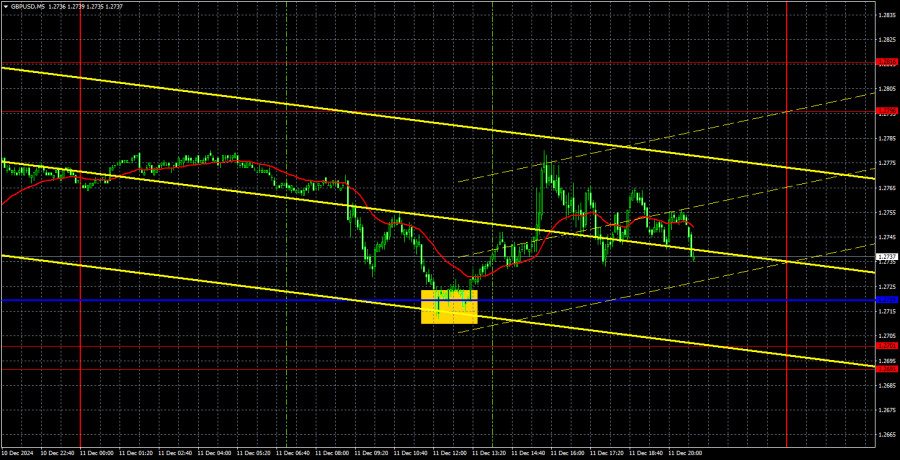
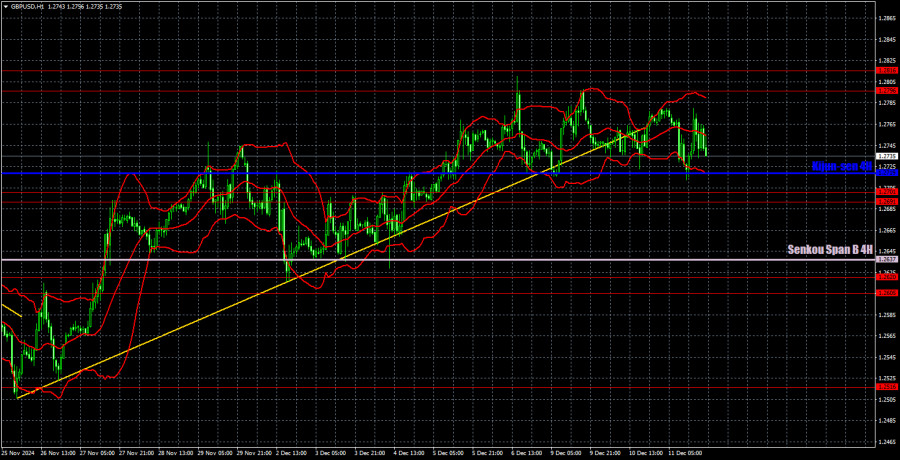
The GBP/USD pair continued to trade sideways on Wednesday. A couple of days ago, the ascending trend line was overcome, the first sign of a downward trend reversal. However, we would like to remind you that it is always better to wait for some confirmation. For example, in our case, the price has not yet consolidated even below the critical Kijun-sen line. Thus, there is no talk of the pound falling right now. This week's fundamental and macroeconomic background did not favor the growth of the dollar either. We did not have any important speeches from the representatives of the Federal Reserve and the Bank of England, as the so-called "silence mode" is on. Next week, both central banks will hold the last meetings of the current year, so their representatives are forbidden from giving any comments. And almost the only report this week (on U.S. inflation) turned out to be bland and simply could not provoke a strong market reaction. Thus, the pair is still inside the local flat.
We still expect the British currency to fall, but we remind you that any correction can last long enough. And the fact that the pair is now correcting against a two-month decline, there is no doubt. But, as we have already said, to expect the resumption of the downtrend, the pair must at least overcome the Kijun-sen line.
As for trading signals, only one was formed yesterday. The price fell to the Kijun-sen line during the European trading session, from which it bounced quite eloquently. Thus, traders could open long positions. The price failed to reach the target level but rose a few tens of pips.
COT Report

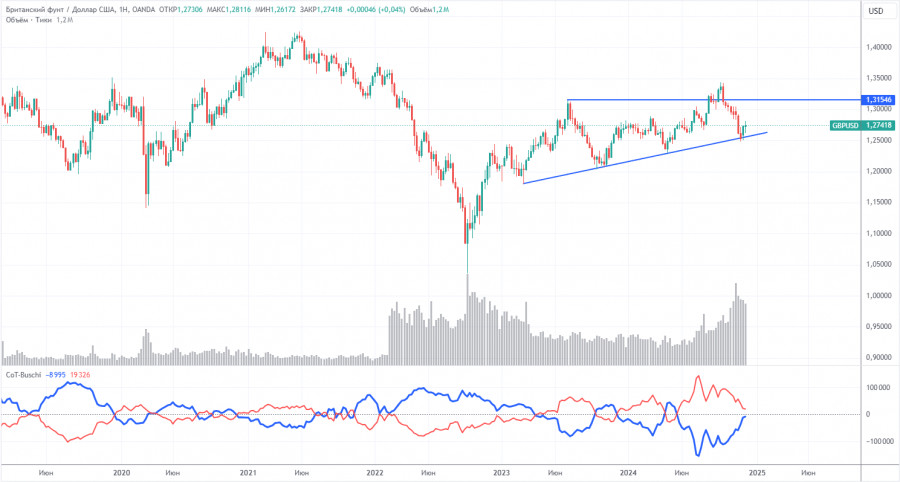
COT reports for the British pound reveal that the sentiment among commercial traders has fluctuated significantly over the past years. The red and blue lines representing net positions of commercial and non-commercial traders frequently cross and typically remain near the zero mark. The price has broken through the 1.3154 level and subsequently approached the trendline. We believe the trend has shifted to bearish, and further consolidation below the trendline is anticipated.
The latest COT report shows that the "non-commercial" group closed 400 BUY contracts and opened 1,900 SELL contracts. As a result, the net position of non-commercial traders decreased by 2,300 contracts over the week.
The fundamental backdrop does not justify long-term purchases of the pound sterling. The currency has a genuine chance to resume its broader downtrend. While the trendline has thus far prevented further declines, failure to breach it could lead to a new upward wave, potentially pushing the pound above 1.3500. However, what fundamental basis exists for such growth at the moment?
GBP/USD 1-Hour Analysis

The GBP/USD pair maintains a bearish tone on the hourly timeframe, although it continues to correct upward. Aside from the technical necessity of periodic corrections, we still see no fundamental reasons for the pound's growth. However, the pound's remarkable resilience once again works in its favor. The British pound is rising even where the euro remains stagnant or where no growth would typically be expected. At the moment, a local flat has formed for the pair.
For December 11, we highlight the following important levels: 1.2429-1.2445, 1.2516, 1.2605-1.2620, 1.2796-1.2816, 1.2863, 1.2981-1.2987, 1.3050. Senkou Span B (1.2637) and Kijun-sen (1.2719) lines can also be sources of signals. Set a Stop Loss to break even after the price moves 20 pips in the correct direction to minimize potential losses in case of false signals. The Ichimoku indicator lines may shift during the day, so adjustments should be made when determining trading signals.
No significant events are scheduled for Thursday in the UK, and in the US, only the Producer Price Index will be published. The index has an extremely weak value after the inflation report was published. Only the European Central Bank meeting and Christine Lagarde's speech can trigger a move today. The euro might pull the pound with it.
Illustration Explanations:
- Support and Resistance Levels (thick red lines): Key areas where price movement might stall. Not sources of trading signals.
- Kijun-sen and Senkou Span B Lines: Ichimoku indicator lines transferred from the H4 timeframe to the hourly chart, serving as strong levels.
- Extreme Levels (thin red lines): Points where the price has previously rebounded. They can serve as trading signal sources.
- Yellow Lines: Trendlines, channels, or other technical patterns.
- Indicator 1 on COT Charts: Reflects the net position size of each trader category.
from Forex analysis review https://ift.tt/QcotSnO
via IFTTT
