EUR/USD 5-Minute Analysis

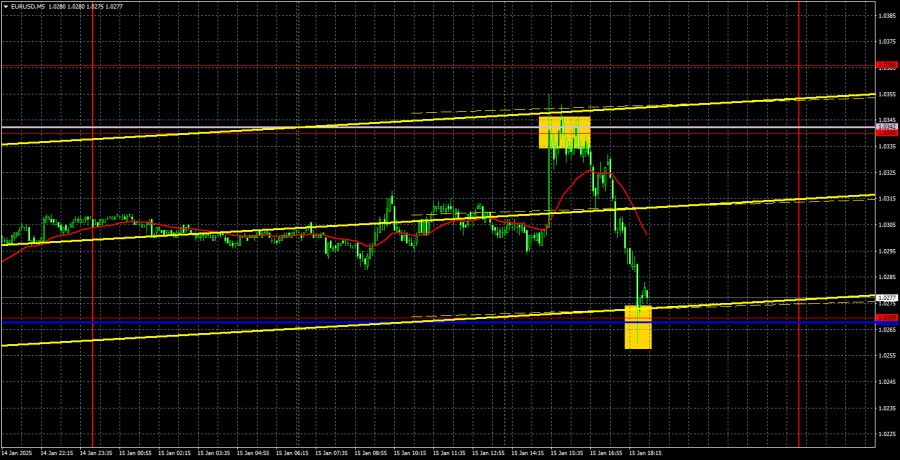
On Wednesday, the EUR/USD currency pair initially traded upward for most of the day but later lost all its gains as the euro declined significantly. In our fundamental analysis, we highlighted the mixed nature of the U.S. inflation report. The market's initial reaction was to sell the dollar, which seemed somewhat irrational. While the headline inflation figure met expectations, U.S. inflation still increased, indicating that the Federal Reserve might not lower rates as much as the two modest rate cuts anticipated in 2025. This situation is further complicated by Donald Trump's upcoming presidency, which may bring various tariffs that could escalate global inflation.
The evening decline in the euro was more understandable. First, the global downtrend remains in effect. Second, the fundamental and macroeconomic conditions continue to favor the dollar. Third, the price corrected and rebounded precisely from the Senkou Span B line. Even on the previous day, there were reasons to consider buying the dollar again, despite the mixed inflation report.
Trading signals on Wednesday were excellent. During the U.S. session, the currency pair tested the 1.0340 level and the Senkou Span B line, rebounding sharply. This was followed by a decline that again tested this critical line, from which the price also bounced. As a result, traders had the opportunity to open two trades that yielded profit. A long position can even be maintained.
COT Report

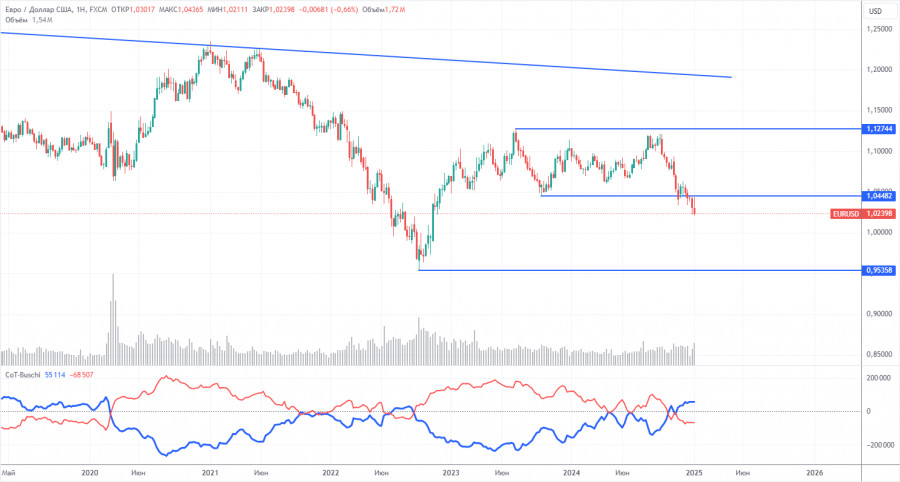
The latest Commitment of Traders (COT) report, dated December 31, indicates that non-commercial traders maintain a bullish net position. However, bears have recently gained the upper hand. Two months ago, the number of short positions among professional traders surged, resulting in a negative net position for the first time in a long while. This change suggests that the euro is being sold more frequently than it is being bought.
We have yet to identify any fundamental drivers for euro strength. From a technical perspective, the EUR/USD pair has been consolidating for quite some time. On the weekly timeframe, it has traded between 1.0448 and 1.1274 since December 2022. The breach of the 1.0448 level has opened the door for further declines.
Additionally, the COT data shows that the red and blue lines have crossed, signaling a bearish market sentiment. In the last reporting week, long positions among non-commercial traders increased by 9,300, while short positions rose by 10,400, resulting in a reduction of the net position by 1,100.
EUR/USD 1-Hour Analysis

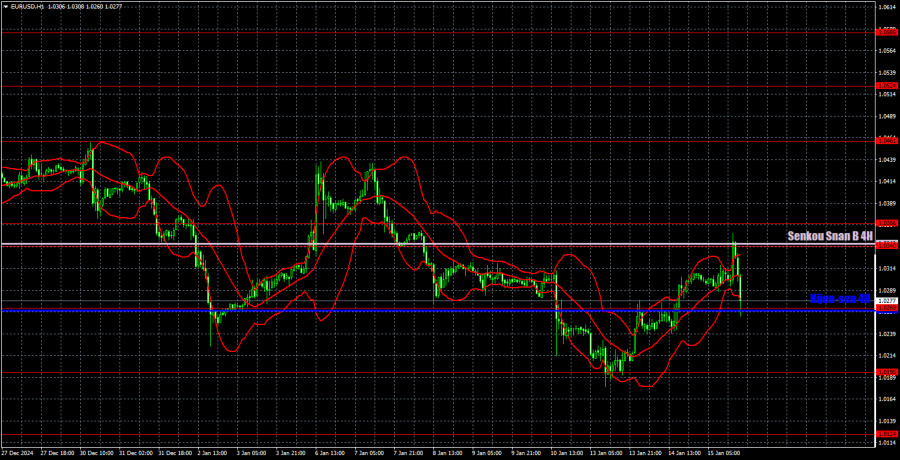
On the hourly chart, the currency pair has resumed its downtrend, which has persisted for over three months. We believe this decline will continue in the medium term. The Fed might cut interest rates just 1–2 times in 2025, indicating a more hawkish stance than the market initially expected. This factor, among others, will continue to support the U.S. dollar. The bearish sentiment remains intact below the Ichimoku indicator lines, even in the short term.
For trading on January 16, the following levels are highlighted: 1.0124, 1.0195, 1.0269, 1.0340–1.0366, 1.0461, 1.0524, 1.0585, 1.0658–1.0669, 1.0757, 1.0797, and 1.0843, as well as the Senkou Span B (1.0342) and Kijun-sen (1.0267) lines. Please note that the Ichimoku indicator lines may shift throughout the day, which should be considered when determining trading signals. Remember to set a Stop Loss at breakeven if the price moves 15 pips in your favor, to protect against potential losses from false signals.
On Thursday, the Eurozone will release a secondary report on German inflation, while the U.S. is set to publish slightly more significant retail sales data and equally secondary jobless claims. Therefore, we do not expect strong price movements today. Below the Senkou Span B line, even a short-term uptrend remains unlikely.
Illustration Explanations:
- Support and Resistance Levels (thick red lines): Thick red lines indicate where movement may come to an end. Please note that these lines are not sources of trading signals.
- Kijun-sen and Senkou Span B Lines: Ichimoku indicator lines transferred from the 4-hour timeframe to the hourly timeframe. These are strong lines.
- Extreme Levels (thin red lines): Thin red lines where the price has previously bounced. These serve as sources of trading signals.
- Yellow Lines: Trendlines, trend channels, or any other technical patterns.
- Indicator 1 on COT Charts: Represents the net position size for each category of traders.
from Forex analysis review https://ift.tt/xrI2LtE
via IFTTT
