

Last Friday, EUR/USD pierced the 23.6% Fibonacci retracement level with a lower shadow and then sharply reversed to the upside, continuing to rise into Monday morning. The Marlin oscillator appears to have stopped its decline and is also turning upward.
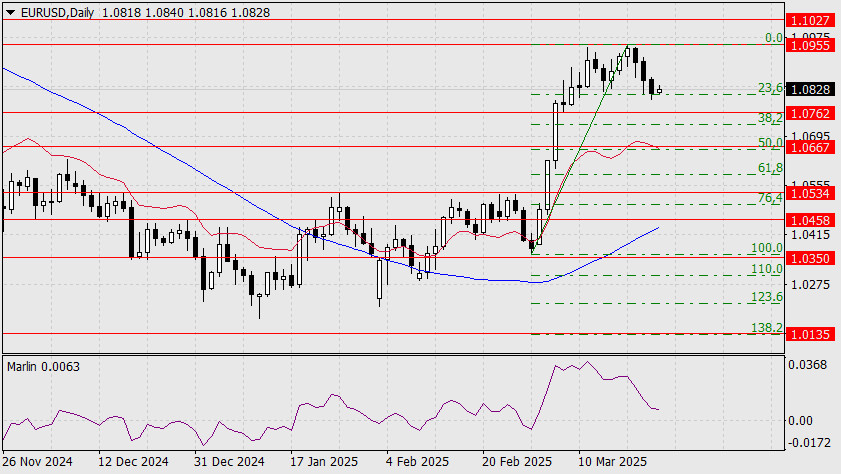
If the upward move is confirmed on lower timeframes, the rally may extend toward the recent high at 1.0955 and then further to 1.1027 — the September 3, 2024 low.
On the H4 chart, the Marlin oscillator is about to enter positive territory.
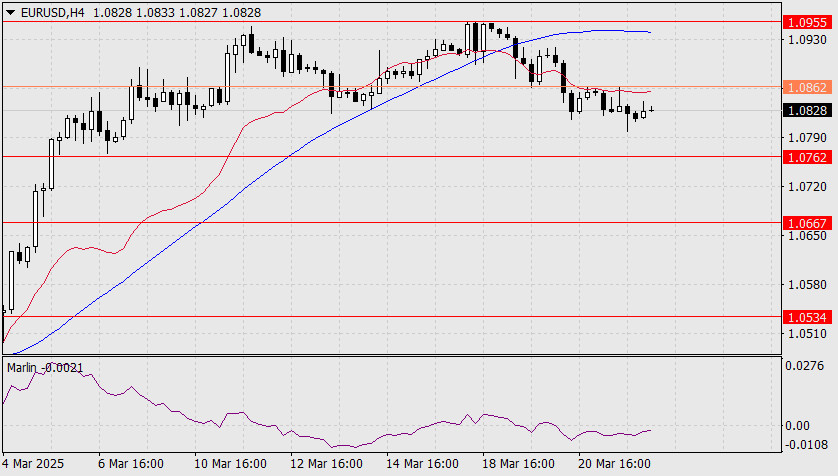
Once the price consolidates above the intermediate level of 1.0862 (Friday's high), the uptrend may continue toward the first target of 1.0955. A drop below the support level 1.0762 would open the path toward the next target at 1.0667, close to the 50.0% Fibonacci retracement level.
The material has been provided by InstaForex Company - www.instaforex.comfrom Forex analysis review https://ift.tt/rjzNpHD
via IFTTT