

Trend Analysis
In October, from the level of 1.3441 (closing of the September monthly candle), the price may begin moving upward with the target at 1.3990 – the historical resistance level (blue dashed line). When testing this level, the price may roll back downward toward 1.3786 – the upper fractal (red dashed line).
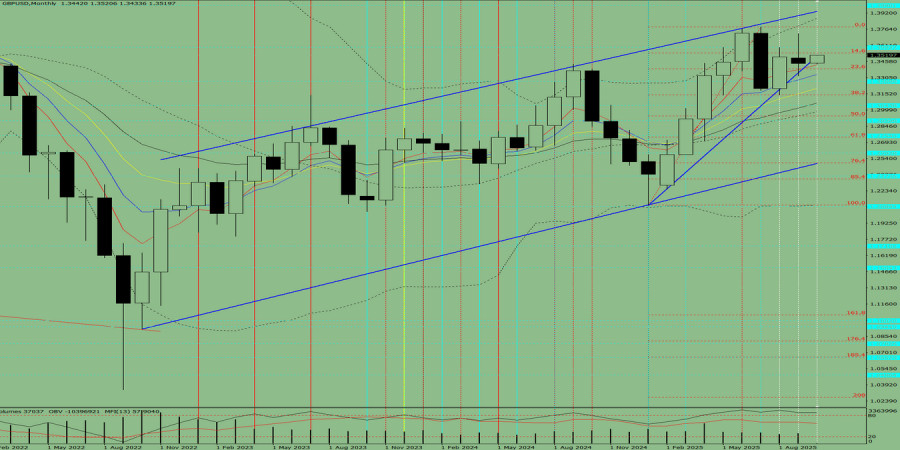
Fig. 1 (monthly chart).
Indicator Analysis:
- Indicator analysis – upward;
- Fibonacci levels – upward;
- Volumes – upward;
- Candlestick analysis – upward;
- Trend analysis – upward;
- Bollinger Bands – upward.
Comprehensive analysis conclusion: an upward trend is possible.
Overall outcome for the GBP/USD monthly candle calculation: the price will most likely have an upward trend, with the absence of the first lower shadow of the monthly white candle (first week of the month – white) and the presence of the second upper shadow (last week of the month – black).
Alternative scenario: from the level of 1.3441 (closing of the September monthly candle), the price may begin moving upward with the target at 1.3786 – the upper fractal (red dashed line). When testing this level, the price may roll back downward with the target at 1.3592 – the historical resistance level (blue dashed line).
The material has been provided by InstaForex Company - www.instaforex.comfrom Forex analysis review https://ift.tt/YsCTQK7
via IFTTT