

Analyzing Thursday's trades:
GBP/USD on 30M chart
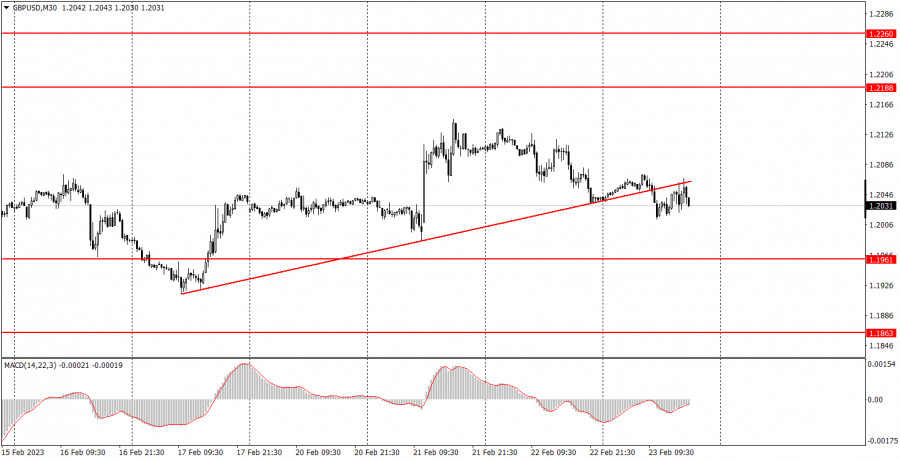
GBP/USD also traded with low volatility and settled below the ascending trend line, which we called "formal" on Wednesday. First of all, the pound is not set up for growth right now, and the bulls are not in the mood to be active. This week, the pair ended a day in favor of the British currency, but on this day the UK released data which provoked growth. Now everything is in place. The pair is getting sluggish since we will not receive any important data. Besides the "important" report on European inflation, there was also a significant report on US GDP. The GDP rose by 2.7% in the second estimate and absolutely nobody was interested in it, because the second estimate is not the first and not the last one. What is the point of reacting to an intermediate estimate? The same can be said about the Federal Reserve's minutes, which contained some hawkish talking points that are very hard to translate into concrete actions by the central bank going forward. Last night the volatility was 40 points, on Thursday, it was about 60...
GBP/USD on 5M chart
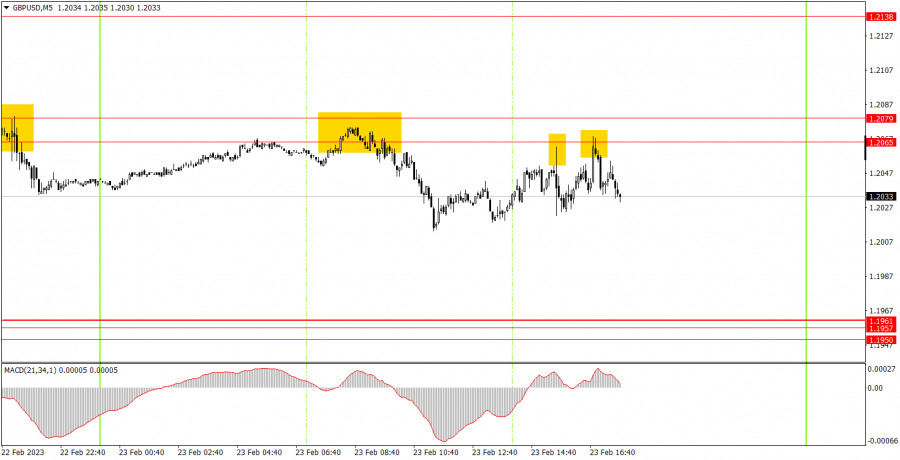
On the 5-minute chart, you can clearly see that the pair was moving more sideways than up or down for almost the entire day. Luckily, the upper limit of the range coincided with the area of 1.2065-1.2079, around which there were three sell signals. In the first case, the price went down about 40 pips, in the second by 15, in the third by about 30. Therefore, beginners could price the first two signals, and during the formation of the third, the second buy signal would still have to be open. As a result, both positions closed at Stop Loss at breakeven. Once again, please remember that it is very difficult to trade in a flat and we can consider this as a positive day since it ended without loss.
Trading tips on Friday:
On the 30-minute chart, GBP/USD continues a sluggish downward movement, which is fully in line with our expectations. Bears continue to "rule the ball", but the pressure they exert on the pair is clearly weak. There is almost no news and reports, and the incoming ones are even less important. On the 5-minute chart, it is recommended to trade at the levels 1.1863-1.1877, 1.1950-1.1957-1.1961, 1.2065-1.2079, 1.2138, 1.2171-1.2179 and 1.2245-1.2260. As soon as the price passes 20 pips in the right direction, you should set a Stop Loss to breakeven. Bank of England representative Silvana Tenreyro is scheduled to speak in the UK on Friday. In the US, we have reports on consumer sentiment and personal income/expenses of the US population. These data are unlikely to cause more than a 20-30 point reaction. We might witness weak volatility again.
Basic rules of the trading system:
1) The strength of the signal is determined by the time it took the signal to form (a rebound or a breakout of the level). The quicker it is formed, the stronger the signal is.
2) If two or more positions were opened near a certain level based on a false signal (which did not trigger a Take Profit or test the nearest target level), then all subsequent signals at this level should be ignored.
3) When trading flat, a pair can form multiple false signals or not form them at all. In any case, it is better to stop trading at the first sign of a flat movement.
4) Trades should be opened in the period between the start of the European session and the middle of the US trading hours when all positions must be closed manually.
5) You can trade using signals from the MACD indicator on the 30-minute time frame only amid strong volatility and a clear trend that should be confirmed by a trendline or a trend channel.
6) If two levels are located too close to each other (from 5 to 15 pips), they should be considered support and resistance levels.
On the chart:
Support and Resistance levels are the levels that serve as targets when buying or selling the pair. You can place Take Profit near these levels.
Red lines are channels or trend lines that display the current trend and show in which direction it is better to trade now.
The MACD indicator (14, 22, and 3) consists of a histogram and a signal line. When they cross, this is a signal to enter the market. It is recommended to use this indicator in combination with trend patterns (channels and trendlines).
Important announcements and economic reports that can be found on the economic calendar can seriously influence the trajectory of a currency pair. Therefore, at the time of their release, we recommend trading as carefully as possible or exiting the market in order to avoid sharp price fluctuations.
Beginners on Forex should remember that not every single trade has to be profitable. The development of a clear strategy and money management is the key to success in trading over a long period of time.
The material has been provided by InstaForex Company - www.instaforex.comfrom Forex analysis review https://ift.tt/iEqeADQ
via IFTTT