

Long-term outlook.
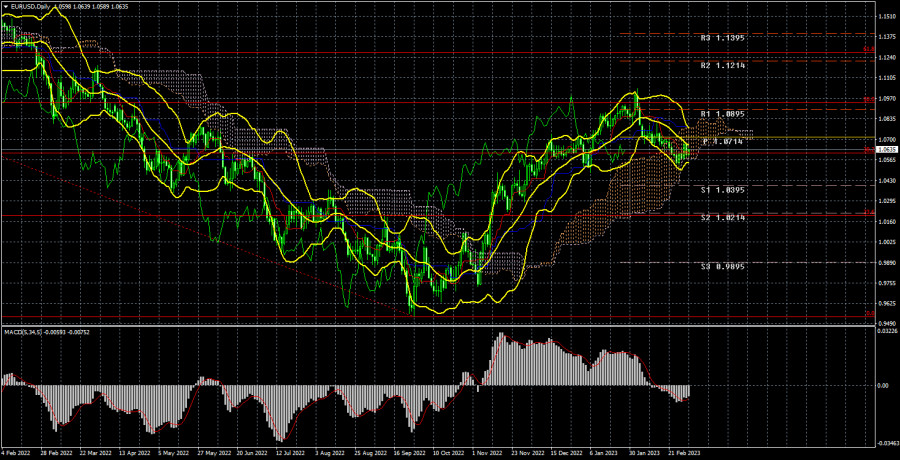
Although the EUR/USD currency pair has moved slightly higher this week, overall volatility has been relatively low. The pair was still inside the Ichimoku cloud at the end of the week on a 24-hour TF, so it is impossible to predict that the fall will continue. The Senkou Span B line is still insurmountable. Recall that the pair displayed a rather strong increase within which it adjusted for many months by 50% of the entire downward trend, which lasted two years. This is evident in the image above. Since we have stated time and time again that such growth is unwarranted and excessively strong, we now anticipate a downward correction. And right now, we don't believe it's finished. The fundamental basis for the pair has recently deteriorated marginally, as have the prospects for the European currency. The market has had plenty of time to adjust to the rate hikes that the ECB has already announced. Also, there haven't been any indications of a potential new tightening of monetary policy.
Joachim Nagel, Luis de Guindos, and Christine Lagarde all delivered speeches this week. They all acknowledged that the rate might increase after the March meeting, but the market has already seen this before. The ECB rate is currently 3%, and it will undoubtedly increase to 3.5% following the March meeting. As a result, this rate is insufficient for inflation to reach 2% in the future. It follows that it will undoubtedly continue increasing. At least if the ECB addresses the rapid price growth and does not only "pretend," as it did throughout the first half of last year.
The Fed will maintain the rate increase at its current level of 4.75% at the same time. The Fed also has no choice but to keep tightening monetary policy because the US's rate of declining inflation has reduced to a minimum level. As a result, while the dollar should increase from a technical perspective, it should also increase from a fundamental perspective.
COT evaluation.
A new COT report on February 7 was publicly disclosed on Friday. That was about a month ago. It appears that instead of the previous three-day delay, the Commodities Futures Trading Commission would now issue findings one month later. If this is the case, then the value of these reports is significantly diminished. Nevertheless, we will continue to evaluate them in the hopes that things will improve in the future. Thus far, we can claim that the picture accurately reflects what has been happening in the market during the past few months. The aforementioned image unequivocally demonstrates that since the start of September 2022, the net position of significant players (the second indicator) has been improving. At about the same time, the value of the euro started to increase. Although the net position of non-commercial traders is currently "bullish" and growing virtually weekly, it is the relatively high value of the "net position" that now permits the upward trend's approaching end. This is indicated by the first indicator, which frequently occurs before the end of a trend and on which the red and green lines are quite far apart. The euro has already started to decline, although it's unclear if this is just a small pullback or the start of a new low. The number of buy contracts from the "non-commercial" group fell by 8,400 during the most recent reporting week, while the number of shorts increased by 22,900. As a result, the net position increased once again by 14,500 contracts. For non-commercial traders, the number of buy contracts is currently 165,000, or three times larger than the number of sell futures. Nonetheless, the correction has been developing for a while, so it is obvious even without news that the pair should keep falling.
Analysis of important events.
The European Union's February inflation data was the week's most important report. The primary inflation indicator dropped from 8.6% to 8.5%, which is unquestionably a very small change. As if nothing had changed, core inflation accelerated and is now at 5.6%. Recall that central banks focus more on core inflation, which ignores changes in the price of food and energy. Inflation is therefore increasing, not decreasing, according to the ECB. Interestingly, this information did not cause the European currency to strengthen. As we've already mentioned, this might occur because the market has already priced in the rate rises that have been announced or because it no longer has faith in the ECB's capacity to tighten monetary policy "to the bitter end." However, despite having every opportunity to do so, support for the euro currency was not given. Nearly all other reports barely affected the market. The only orders for long-term goods placed in the US on Monday caused the dollar to decline.
1) In the 24-hour period, the pair is still moving downward and has broken through the Kijun-sen line. This is part of the trading strategy for the week of March 6–10. As a result, targets in the range of 1,0200-1,0300 can still be reached if the Senkou Span B line does not stop the fall. We think that sales are still respectable, and this past week we saw a pause before a new collapse.
2) The purchases of the euro/dollar pair are no longer significant. You should now wait for the price to return above the critical Ichimoku indicator lines before you start to think about long positions. There are currently no circumstances in which the euro currency can start moving higher again. But, in the present world, anything can happen at any time.
Explanations for the illustrations:
Fibonacci levels, which serve as targets for the beginning of purchases or sales, and price levels of support and resistance (resistance/support). Take Profit levels may be positioned close by.
Bollinger Bands, MACD, and Ichimoku indicators (standard settings) (5, 34, 5).
The net position size of each trading category is represented by indicator 1 on the COT charts.
The net position size for the "Non-commercial" category is shown by indicator 2 on the COT charts.
The material has been provided by InstaForex Company - www.instaforex.comfrom Forex analysis review https://ift.tt/icoED9O
via IFTTT