

Analyzing Thursday's trades:
EUR/USD on 30M chart
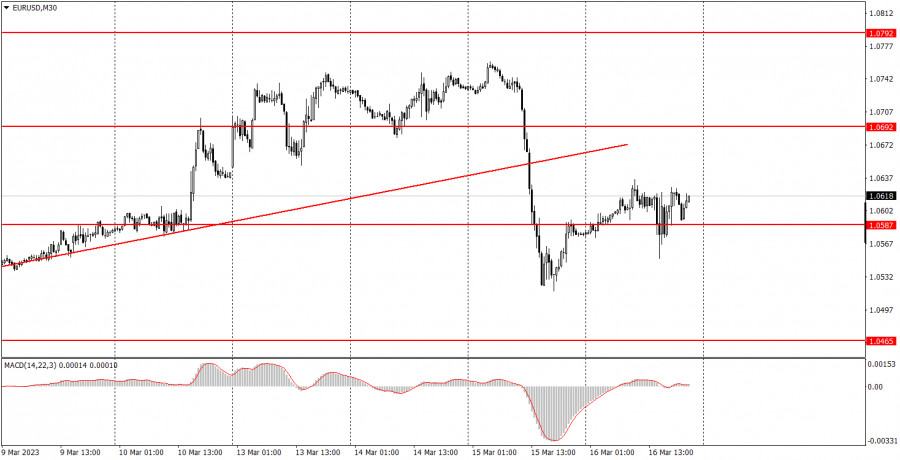
On Thursday, EUR/USD showed ultra-chaotic movements. If in the morning, the pair was trying to continue the bullish correction after the collapse on Wednesday, then in the second part of the day, it rejoiced. Naturally, there was no question of any deliberate and conscious trading. At that time, the European Central Bank announced the results of its second meeting in 2023, which wasn't surprising at all. The rate grew by 0.5%, as market participants have been waiting for it for several months. Recall that the desire to raise the rate three times by 0.5%, 0.5% and 0.25% has been known for a long time. Thus, the euro did not rise or fall on this decision. ECB President Christine Lagarde did not say anything at the press conference that would provide an advantage to the bulls or the bears either. was as concise and careful in her expressions as possible. In fact, the market had nothing to react to. It was in a state of momentum and emotion for several hours, but even during that time, no strong moves happened. So, formally we have a new downtrend, but on the higher charts, the "swing" still exists, so the pair can continue to jump up and down.
EUR/USD on 5M chart
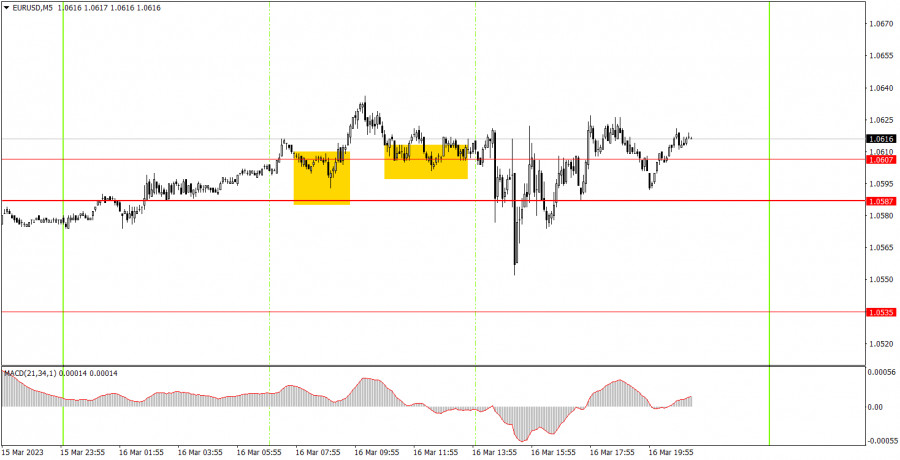
On the 5-minute chart, you can clearly see what the movement was on Thursday. During the US trading session, when the results of the ECB meeting were summed up, the pair was jumping around. By that time there were two trading signals around the area of 1.0587-1.0607. Both of them turned out to be false. Therefore, the succeeding signals should not have been used. As for the first two, the first signal allowed the pair to go up 24 points, so beginners should have set the Stop Loss to breakeven, which was used to close the position. The second one for long positions should have been closed before the results were announced, as market reaction could be unpredictable. As a result, there was no loss on it.
Trading tips on Friday:
On the 30-minute chart, the pair quickly finished forming a new uptrend. Given the state of the "swing", the pair can move in any direction, regardless of the macroeconomic background. And it remains quite strong: the ECB meeting on Thursday, the EU inflation report on Friday. On the 5-minute chart, it is recommended to trade at the levels 1.0391, 1.0433, 1.0465-1.0483, 1.0535, 1.0587-1.0607, 1.0692, 1.0737, 1.0792, 1.0857-1.0867. As soon as the price passes 15 pips in the right direction, you should set a Stop Loss to breakeven. No interesting data will be released in the US on Friday. Industrial production and Michigan consumer sentiment index are unlikely to cause any reaction from the market, unless their values turn out to be very different from the forecasts. In Europe, the February inflation report is very important, to say the least.
Basic rules of the trading system:
1) The strength of the signal is determined by the time it took the signal to form (a rebound or a breakout of the level). The quicker it is formed, the stronger the signal is.
2) If two or more positions were opened near a certain level based on a false signal (which did not trigger a Take Profit or test the nearest target level), then all subsequent signals at this level should be ignored.
3) When trading flat, a pair can form multiple false signals or not form them at all. In any case, it is better to stop trading at the first sign of a flat movement.
4) Trades should be opened in the period between the start of the European session and the middle of the US trading hours when all positions must be closed manually.
5) You can trade using signals from the MACD indicator on the 30-minute time frame only amid strong volatility and a clear trend that should be confirmed by a trendline or a trend channel.
6) If two levels are located too close to each other (from 5 to 15 pips), they should be considered support and resistance levels.
On the chart:
Support and Resistance levels are the levels that serve as targets when buying or selling the pair. You can place Take Profit near these levels.
Red lines are channels or trend lines that display the current trend and show in which direction it is better to trade now.
The MACD indicator (14, 22, and 3) consists of a histogram and a signal line. When they cross, this is a signal to enter the market. It is recommended to use this indicator in combination with trend patterns (channels and trendlines).
Important announcements and economic reports that can be found on the economic calendar can seriously influence the trajectory of a currency pair. Therefore, at the time of their release, we recommend trading as carefully as possible or exiting the market in order to avoid sharp price fluctuations.
Beginners on Forex should remember that not every single trade has to be profitable. The development of a clear strategy and money management is the key to success in trading over a long period of time.
The material has been provided by InstaForex Company - www.instaforex.comfrom Forex analysis review https://ift.tt/XlZ9Yr7
via IFTTT