

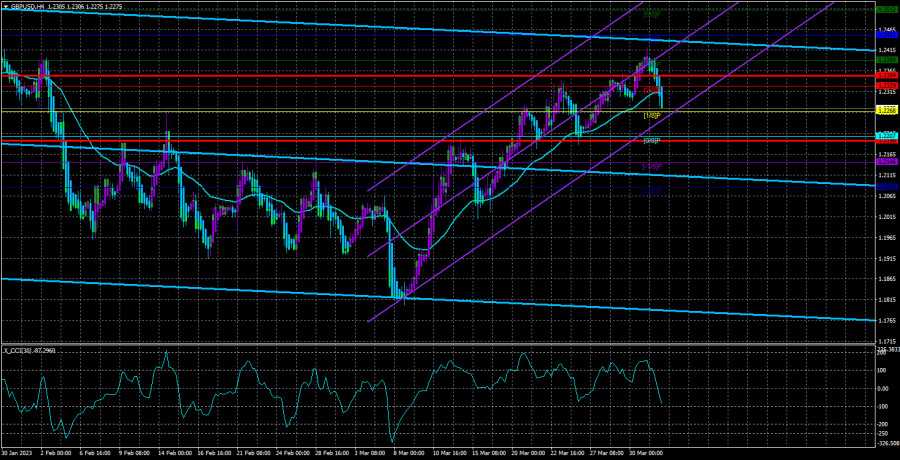
On Friday, GBP/USD went down, although it was a sluggish movement to call it a downtrend. Still, there was one important thing. In the 24-hour time frame, the pair was in the sideways channel between 1.1840 and 1.2440. Last week, it approached the upper limit. Therefore, there should have been a bearish reversal. So, the pair may now plummet due to technical reasons only. The pound has already risen by 2,100 pips and will hardly go any farther. The Bank of England will likely raise rates higher than the US Federal Reserve this year. However, that would hardly make the sterling stronger versus the greenback in the long term. Judging by the fact that the corrective move after a 2,100-pip increase is weak enough, we may say that the correction is still ongoing and the sterling will rather be bearish again.
Moreover, it remains to be seen how many times the American regulator lifts rates. Chair Powell's rhetoric may change depending on macro data. Last month, he assumed the central bank could stay aggressive longer. Last week, information about just one rate increase surfaced. Therefore, we can't know for sure that the Federal Reserve has actually finished tightening. So, there are still no reasons for the sterling to stay bullish in the long term. The British economy is balancing on the edge of a recession. Meanwhile, the American economy is expanding by 3-4% per quarter. That is why there is a greater likelihood of higher rates in the United States. The Bank of England has reduced the pace of rate increases to the minimum, which suggests that the end of tightening in the United Kingdom might be nearing.
This week will be quite uneventful in the United Kingdom, with only data on business activity coming. In the United States, the situation will be slightly different as unemployment and NonFarm Payrolls are due on Friday. These are currently the most important reports along with inflation. In March, the unemployment rate is projected to come at 3.6%, unchanged from the previous month, and NFPs to be 238,000-250,000, down from 311,000 in the previous month and down from 504,000 in the month before last. It may seem that figures will decline and harm the dollar. However, any reading above 200,000 is seen as a positive one. The market will highly likely start pricing the report in advance. On Friday, it will see whether it has bet right or the data will disappoint. Anyway, this will be a crucial moment for GBP/USD.
Other important reposts in the United States this week are the ISM Manufacturing PMI, Job Openings, ADP Employment Change, and the ISM Services PMI. Still, all eyes will be on Nonfarm Payrolls. Anyway, these data may not affect the market. If the euro and the pound remain within sideways channels, they may decrease against the dollar simply because the price usually goes to the lower limit from the upper one. Therefore, we expect the pair to drop. Moreover, volatility recently changed significantly. A move of 78 pips in a day is not much for the pound.
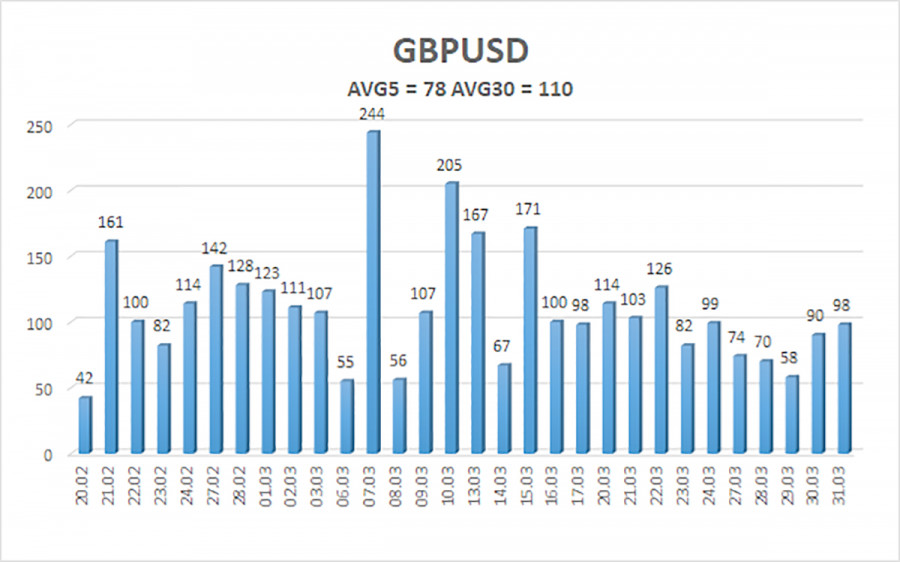
The 5-day volatility of GBP/USD is 78 pips and is seen as moderate. On April 3, the pair is likely to move within a channel between 1.2198 and 1.2354. Heiken Ashi's upward reversal will signal the resumption of the uptrend.
Support:
S1 – 1.2268
S2 – 1.2207
S3 – 1.2146
Resistance:
R1 – 1.2329
R2 – 1.2390
R3 – 1.2451
Outlook:
In the 4-hour time frame, GBP/USD consolidated below the moving average. We sell with targets at 1.2207 and 1.2198 until Heiken Ashi's upward reversal and consider buying after consolidation above the moving average, targeting 1.2390 and 1.2451.
Indicators on charts:
Linear Regression Channels help identify the current trend. If both channels move in the same direction, a trend is strong.
Moving Average (20-day, smoothed) defines the short-term and current trends.
Murray levels are target levels for trends and corrections.
Volatility levels (red lines) reflect a possible price channel the pair is likely to trade in within the day based on the current volatility indicators.
CCI indicator. When the indicator is in the oversold zone (below 250) or in the overbought area (above 250), it means that a trend reversal is likely to occur soon.
The material has been provided by InstaForex Company - www.instaforex.comfrom Forex analysis review https://ift.tt/S1B9VkN
via IFTTT