

Analyzing Tuesday's trades:
EUR/USD on 30M chart
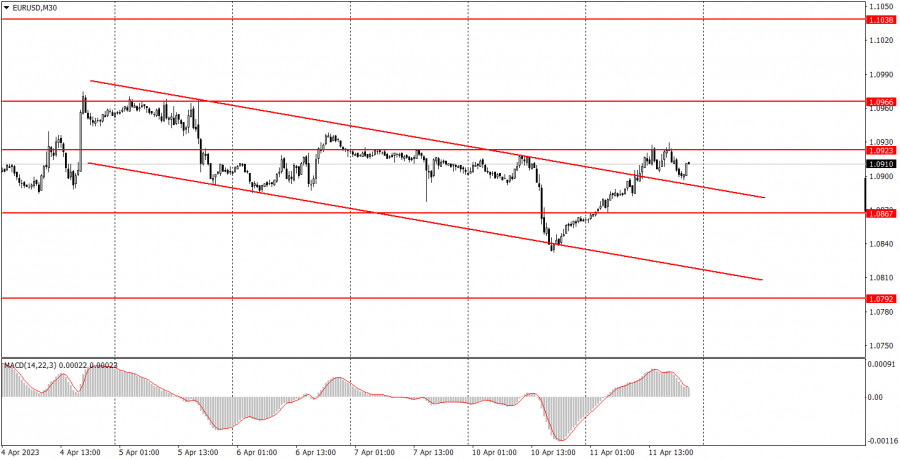
EUR/USD continued to trade higher throughout Tuesday, which began Monday evening. The pair sharply plummeted during Monday's US session, which could be attributed to the market's reaction to Friday's US macro data. However, closer to the evening, the pair traded higher, which persisted throughout Tuesday. We can't really say that the market had no reason to buy the pair. But we have all become accustomed to the fact that in recent weeks, the euro often grows for no particular reason. The price left the downward channel but failed to break through the 1.0923 level. Illogical and chaotic movements may persist. Only one more or less important report was published during the day – retail sales in the European Union. It turned out to be slightly better than forecasts but was still negative. Therefore, the euro's growth was probably not related to it. There was nothing interesting in the US. Volatility was low.
EUR/USD on 5M chart
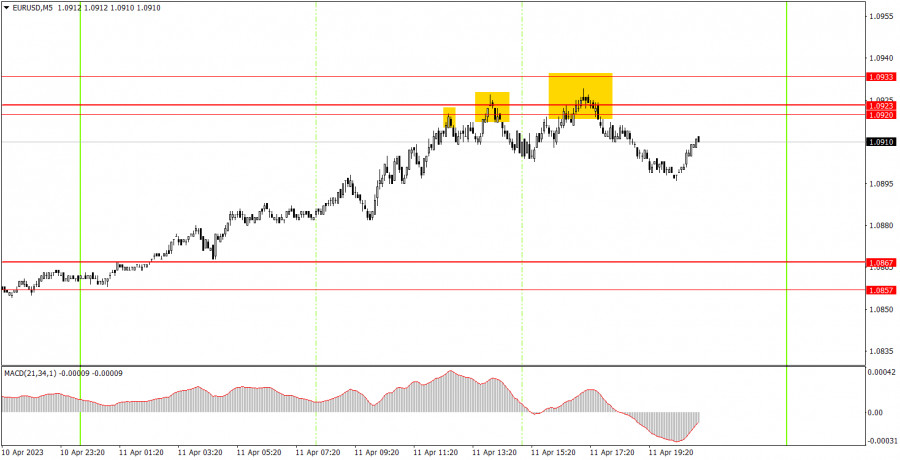
On the 5-minute chart, we can see that the pair moved in one direction during the day, but it was not possible to catch the beginning of this movement. Thus, the first signal was formed around the 1.0920-1.0933 area when the pair had already stopped rising. It was a sell signal, as well as two subsequent ones around the same area. In the first case, the pair moved in the right direction by about 5 points, in the second by 10, and in the third by more than 15. Therefore, only one sell position should have been opened, and traders could even have made around 15 points of profit since there was no buy signal until the end of the day. Consequently, the position needed to be closed manually.
Trading tips on Wednesday:
On the 30-minute chart, the pair quickly completed the bearish correction, which turned out to be very weak again. The consolidation above the descending channel has already occurred, so now we can quite expect a new round of growth from the euro. It will most likely be unfounded again. On the 5-minute chart, it is recommended to trade at the levels 1.0692, 1.0737, 1.0792, 1.0857-1.0867, 1.0920-1.0933, 1.0966, 1.0989, 1.1038, 1.1070, 1.1132. As soon as the price passes 15 pips in the right direction, you should set a Stop Loss to breakeven. On Wednesday, the most important report of the week will be published in America – the inflation report. In the evening, we have the FOMC minutes from the last meeting to look forward to. And nothing in the eurozone. It would be wise to closely monitor the inflation report. Take note that the pair can move in any direction. It is impossible to predict it in advance.
Basic rules of the trading system:
1) The strength of the signal is determined by the time it took the signal to form (a rebound or a breakout of the level). The quicker it is formed, the stronger the signal is.
2) If two or more positions were opened near a certain level based on a false signal (which did not trigger a Take Profit or test the nearest target level), then all subsequent signals at this level should be ignored.
3) When trading flat, a pair can form multiple false signals or not form them at all. In any case, it is better to stop trading at the first sign of a flat movement.
4) Trades should be opened in the period between the start of the European session and the middle of the US trading hours when all positions must be closed manually.
5) You can trade using signals from the MACD indicator on the 30-minute time frame only amid strong volatility and a clear trend that should be confirmed by a trendline or a trend channel.
6) If two levels are located too close to each other (from 5 to 15 pips), they should be considered support and resistance levels.
On the chart:
Support and Resistance levels are the levels that serve as targets when buying or selling the pair. You can place Take Profit near these levels.
Red lines are channels or trend lines that display the current trend and show in which direction it is better to trade now.
The MACD indicator (14, 22, and 3) consists of a histogram and a signal line. When they cross, this is a signal to enter the market. It is recommended to use this indicator in combination with trend patterns (channels and trendlines).
Important announcements and economic reports that can be found on the economic calendar can seriously influence the trajectory of a currency pair. Therefore, at the time of their release, we recommend trading as carefully as possible or exiting the market in order to avoid sharp price fluctuations.
Beginners on Forex should remember that not every single trade has to be profitable. The development of a clear strategy and money management is the key to success in trading over a long period of time.
The material has been provided by InstaForex Company - www.instaforex.comfrom Forex analysis review https://ift.tt/j2rQU6D
via IFTTT