

Trade outlook on April 11:
GBP/USD 30M chart
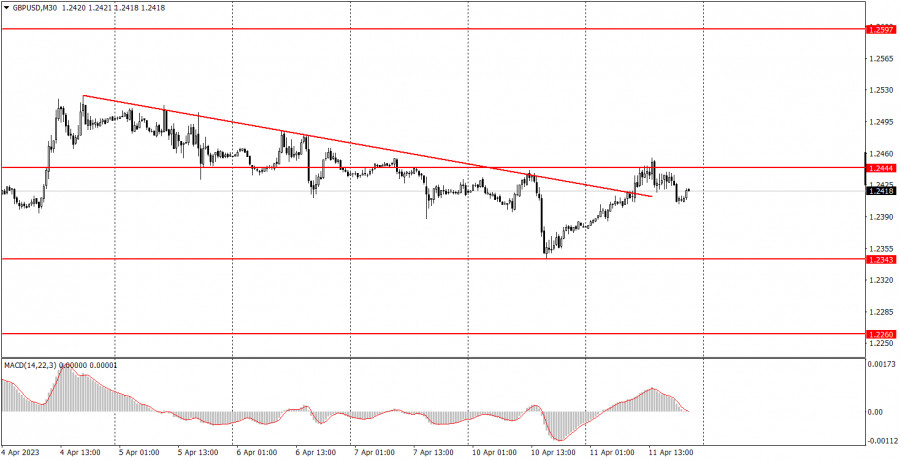
On Tuesday, the GBP/USD pair demonstrated movements strikingly similar to those of the EUR/USD pair. For most of the day, the price trended upwards, breaking the downward trend line before bouncing off the nearest resistance level at 1.2444. Consequently, the weak downward trend has been disrupted, potentially allowing the pair to resume growth. However, this trend seems to be unsupported, just like in the case of the euro.
There were no notable events or publications in the United States and the United Kingdom on Tuesday, making the British currency's growth appear baseless. Tomorrow, the US inflation report will be released, which is considered the week's most important report. We won't make any projections regarding this report or the market reaction to it, but it should be noted that the pair's movements are often illogical even on days without a fundamental and macroeconomic context. Tomorrow, this illogical behavior may be even more pronounced, especially considering that we must keep an eye on two indicators simultaneously, specifically the core and headline inflation. Therefore, forecasting the pair's movement will be twice as challenging.
GBP/USD 5M chart
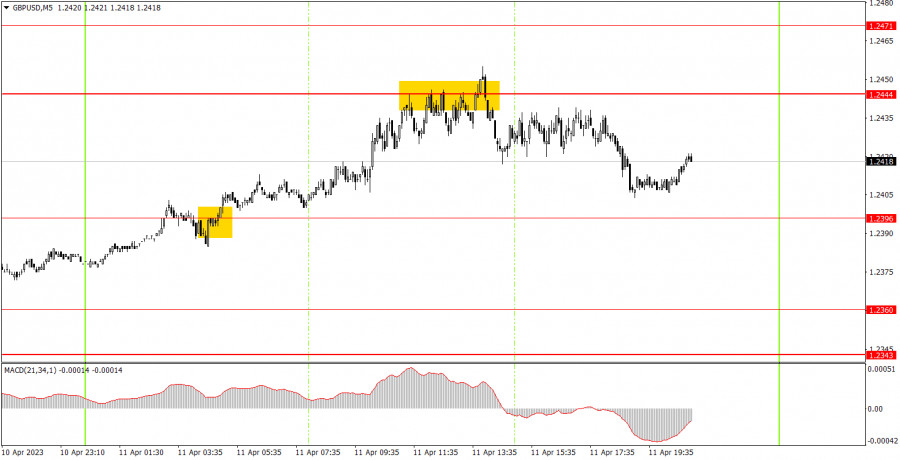
Today, the trade signals on the 5-minute timeframe were once again quite accurate. The first buy signal was formed overnight, but by the European trading session opening, the pair hadn't moved far from the formation point, which opened up buying opportunities. Subsequently, the price reached the nearest target level of 1.2444 and bounced off it five times in a row. At this point, beginner traders were advised to close their long positions with a profit of about 30 pips and open sell positions. Short positions could have yielded around 20 more pips, but such a trade should have been closed manually. The pair's volatility was low today, but no false signals were formed, and the pair traded without any sharp corrections or pullbacks throughout the day, which is always a positive sign.
Trading plan on April 12:
On the 30-minute timeframe, the GBP/USD pair is likely to resume its upward movement as soon as it breaks the trend line. We believe that, in almost any case, the upward movement will be unfounded, as the pound has been moving in this trend for several weeks. Its quote was rising with no good reason for it. Even if tomorrow's inflation report triggers a decline in the dollar, it won't change the situation fundamentally. On the 5-minute timeframe, the target levels are located at 1.2143, 1.2171-1.2179, 1.2245-1.2260, 1.2343-1.2360, 1.2396, 1.2444-1.2471, 1.2577-1.2616, and 1.2659-1.2674. After the price moves in the correct direction by 20 pips following the trade opening, you can set a stop loss at a breakeven point. On Wednesday, two speeches by the Bank of England's Governor Andrew Bailey are scheduled in the United Kingdom, which could be both interesting and important. In the United States, the inflation report, an equally significant event, could fuel an unpredictable market reaction.
The basic principles of a trading system:
1) The signal strength depends on the time period during which the signal was formed (a rebound or a break). The shorter this period, the stronger the signal.
2) If two or more trades were opened at some level following false signals, then any consequent signals near this level should be ignored.
3) During a flat trend, any currency pair may form a lot of false signals or do not produce any signals at all. In any case, the flat trend is not the best condition for trading.
4) Trades are opened in the time period between the beginning of the European session and until the middle of the American session when all deals should be closed manually.
5) We can pay attention to the MACD signals in the 30M time frame only if there is good volatility and a definite trend confirmed by a trend line or a trend channel.
6) If two key levels are too close to each other (about 5-15 pips), then this is a support or resistance area.
How to read a chart:
Support and Resistance price levels can serve as targets when buying or selling. You can place Take Profit levels near them.
Red lines are channels or trend lines that display the current trend and show which direction is better to trade.
MACD indicator (14,22,3) is a histogram and a signal line showing when it is better to enter the market when they cross. This indicator is better to be used in combination with trend channels or trend lines.
Important speeches and reports that are always reflected in the economic calendars can greatly influence the movement of a currency pair. Therefore, during such events, it is recommended to trade as carefully as possible or exit the market in order to avoid a sharp price reversal against the previous movement.
Beginning traders should remember that every trade cannot be profitable. The development of a reliable strategy and money management are the key to success in trading over a long period of time.
The material has been provided by InstaForex Company - www.instaforex.comfrom Forex analysis review https://ift.tt/Lbm53Wq
via IFTTT