

Analyzing Wednesday's trades:
EUR/USD on 30M chart
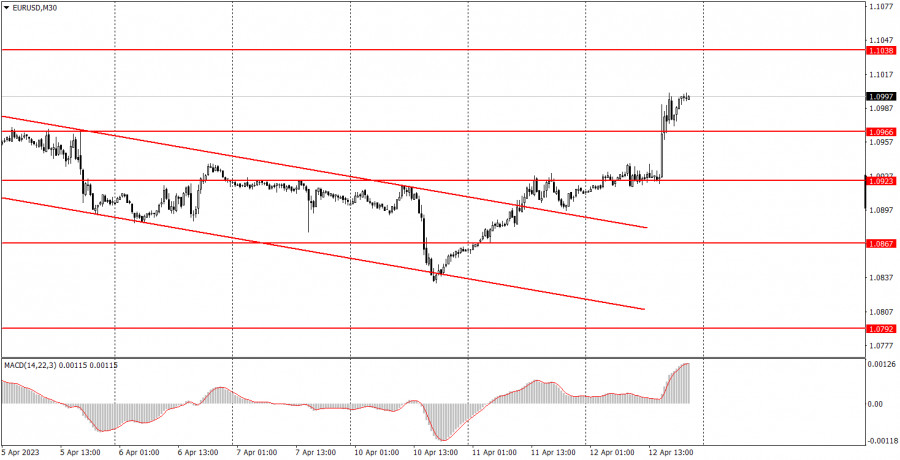
EUR/USD traded higher on Wednesday. Of course, the euro grew for one reason – the US inflation report. Inflation dropped to a record level, decreasing by 1% to 5%. So traders saw this report as a reason why the Federal Reserve is less likely to tighten monetary policy in 2023. And since the market believes that the Fed will no longer raise its key rate, it's no surprise that the dollar fell. However, the second inflation indicator – the core CPI – rose, and this is also important. I believe that the Fed will raise the rate once or twice more. But what matters is what the market believes at this time. Therefore, after the quotes left the descending channel, it was logical for the upward movement to follow. However, the overall growth of the euro still raises many questions. The single currency had a good reason to rise on Wednesday, but over the past month, the reasons were not always apparent.
EUR/USD on 5M chart
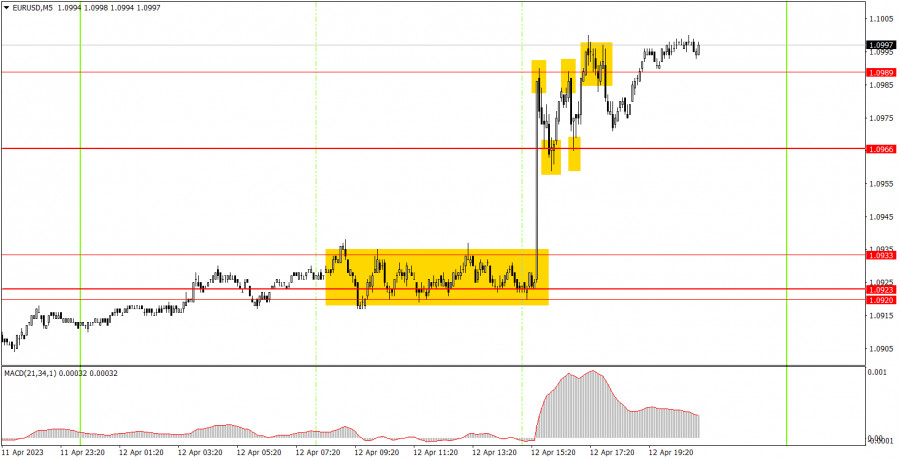
On the 5-minute chart, we can see that the pair showed two absolutely different types of movements during the day. The price stood still throughout the entire European trading session, and immediately after the inflation report was released, it surged. There was no theoretical possibility to open long positions. No buy signal before the inflation report. After the pair rose to 1.0989, a "dance" started between 1.0966 and 1.0989. Beginners could open positions based on signals around these levels, especially since all of them were correct. However, a trader could make a maximum of 5-10 points per signal. Thus, you could've earned a small profit if there was a desire to scalp within the horizontal channel.
Trading tips on Thursday:
On the 30-minute chart, the pair quickly ended the bearish correction, which turned out to be very weak again. The pair consolidated above the descending channel, so now we can reasonably expect a new wave of growth for the euro. It will most likely be groundless again. On the 5-minute chart, the levels to consider are 1.0792, 1.0857-1.0867, 1.0920-1.0933, 1.0966, 1.0989, 1.1038, 1.1070, 1.1132, and 1.1184. As soon as the price passes 15 pips in the right direction, you should set a Stop Loss to breakeven. On Thursday, a relatively important Producer Price Index will be published in the US, as well as a less significant industrial production report. Thus, the movements may be much calmer and, logically, not a trend. But remember that the euro can still rise for no reason.
Basic rules of the trading system:
1) The strength of the signal is determined by the time it took the signal to form (a rebound or a breakout of the level). The quicker it is formed, the stronger the signal is.
2) If two or more positions were opened near a certain level based on a false signal (which did not trigger a Take Profit or test the nearest target level), then all subsequent signals at this level should be ignored.
3) When trading flat, a pair can form multiple false signals or not form them at all. In any case, it is better to stop trading at the first sign of a flat movement.
4) Trades should be opened in the period between the start of the European session and the middle of the US trading hours when all positions must be closed manually.
5) You can trade using signals from the MACD indicator on the 30-minute time frame only amid strong volatility and a clear trend that should be confirmed by a trendline or a trend channel.
6) If two levels are located too close to each other (from 5 to 15 pips), they should be considered support and resistance levels.
On the chart:
Support and Resistance levels are the levels that serve as targets when buying or selling the pair. You can place Take Profit near these levels.
Red lines are channels or trend lines that display the current trend and show in which direction it is better to trade now.
The MACD indicator (14, 22, and 3) consists of a histogram and a signal line. When they cross, this is a signal to enter the market. It is recommended to use this indicator in combination with trend patterns (channels and trendlines).
Important announcements and economic reports that can be found on the economic calendar can seriously influence the trajectory of a currency pair. Therefore, at the time of their release, we recommend trading as carefully as possible or exiting the market in order to avoid sharp price fluctuations.
Beginners on Forex should remember that not every single trade has to be profitable. The development of a clear strategy and money management is the key to success in trading over a long period of time.
The material has been provided by InstaForex Company - www.instaforex.comfrom Forex analysis review https://ift.tt/vYfTS12
via IFTTT