

Analysis of Thursday trades:
EUR/USD 30M chart
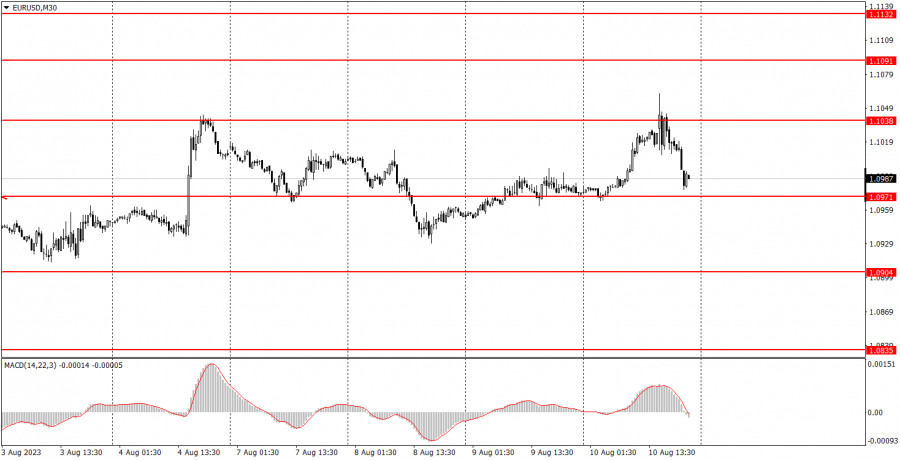
The EUR/USD currency pair showed mixed movements during the fourth trading day of the week, which were entirely prompted by the US inflation report. Yesterday, we mentioned that volatility would most likely increase. It increased indeed, but the pair remained within the sideways channel of 1.0904-1.1038, where it has been stuck for several weeks now. This is because the most significant report of the week was contradictory. The inflation rose to 3.2%, which is below the forecast but higher than the previous figure. Now, the Federal Reserve has more reason to raise the key rate again in September or October. This is a bullish sign for the US dollar, not a bearish one. Therefore, traders who initially were selling the dollar have realized their mistake and started buying it.
EUR/USD 5M chart
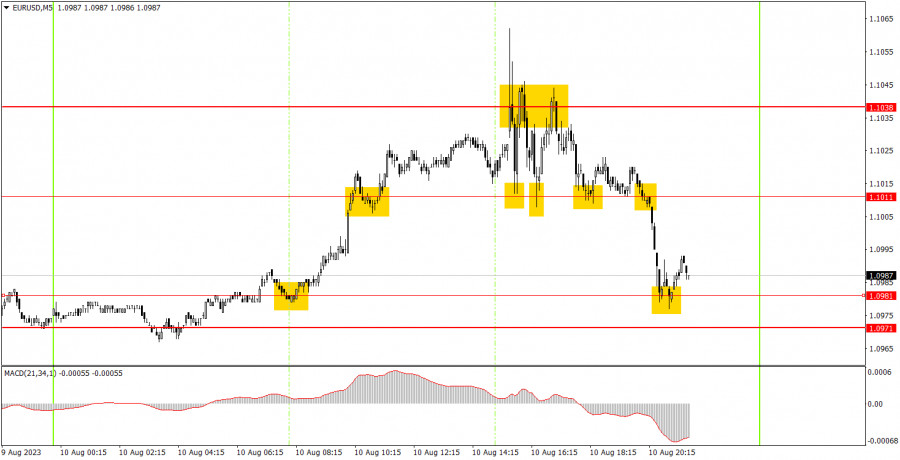
On the 5-minute timeframe on Thursday, numerous trading signals were formed. The first appeared early in the European session when the price rebounded from the 1.0981 mark. Subsequently, the pair surpassed 1.1011 and nearly reached 1.1038 by the onset of the American session. It was advisable to close the buying position before the report release, given its unpredictable nature and the uncertain market response to it. This trade yielded about a 35-point profit. Afterward, the pair oscillated between the 1.1011 and 1.1038 levels for several hours. While one could trade between these levels, we believe it wasn't wise to do so; the pair experienced turbulent movements. The only actionable signal was the selling opportunity around 1.1011, after which the pair reverted to 1.0981. That presented an additional profit of around 20 points.
Trading plan for Friday:
On the 30-minute timeframe, the pair continues its correction and is essentially moving within a sideways channel. We still anticipate a decline, as it remains heavily overbought in the long-term perspective and lacks substantial fundamental reasons for significant growth. There are very few significant events this week, which is reflected in the pair's volatility. On the 5-minute timeframe tomorrow, the key levels can be found at 1.0835, 1.0871, 1.0901-1.0904, 1.0936, 1.0971-1.0977, 1.1011, 1.1038, 1.1091, 1.1132-1.1145, 1.1184, 1.1241, and 1.1279-1.1292. After a move of 15 points in the right direction, set a stop loss to break even. On Friday, there are no significant announcements scheduled in the European Union, while the US will release the Producer Price Index and the Michigan Consumer Sentiment Index, both of which are of minor importance.
The basic principles of a trading system:
1) The strength of the signal depends on the time period during which the signal was formed (a rebound or a break). The shorter this period, the stronger the signal.
2) If two or more trades were opened at some level following false signals, then any consequent signals near this level should be ignored.
3) During the flat trend, any currency pair may form a lot of false signals or do not produce any signals at all. In any case, the flat trend is not the best condition for trading.
4) Trades are opened in the time period between the beginning of the European session and until the middle of the American one when all deals should be closed manually.
5) We can pay attention to the MACD signals in the 30M time frame only if there is good volatility and a definite trend confirmed by a trend line or a trend channel.
6) If two key levels are too close to each other (about 5-15 pips), then this is a support or resistance area.
How to read charts:
Support and Resistance price levels can serve as targets when buying or selling. You can place Take Profit levels near them.
Red lines are channels or trend lines that display the current trend and show which direction is better to trade.
MACD indicator (14,22,3) is a histogram and a signal line showing when it is better to enter the market when they cross. This indicator is better to be used in combination with trend channels or trend lines.
Important speeches and reports that are always reflected in the economic calendars can greatly influence the movement of a currency pair. Therefore, during such events, it is recommended to trade as carefully as possible or exit the market in order to avoid a sharp price reversal against the previous movement.
Beginning traders should remember that every trade cannot be profitable. The development of a reliable strategy and money management are the key to success in trading over a long period of time.
The material has been provided by InstaForex Company - www.instaforex.comfrom Forex analysis review https://ift.tt/QYSgVro
via IFTTT