

The USD/CAD pair is trading in the green at 1.3404 at the time of writing and it tries to come back higher after its correction. In the short term, the price dropped as the Dollar Index crashed. Technically, the price action developed a bullish pattern which needs confirmation.
The pair dropped as low as 1.3372 right after the US economic data. The CPI rose by 0.2% matching expectations, Core CPI increased by 0.2% again in July, while Unemployment Claims came in worse than expected at 248K versus 231K estimated. Tomorrow, the US Prelim UoM Consumer Sentiment, PPI, and Core PPI could move the rate.
USD/CAD rally
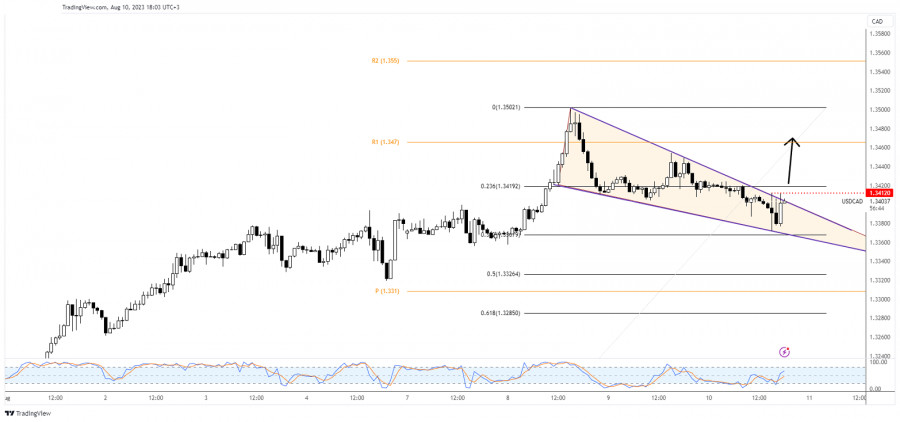
As you can see on the H1 chart, the rate developed a Falling Wedge which could represent a bullish formation. Still, the pattern is far from being confirmed.
As long as it stays below the downtrend line, the USD/CAD pair could come back down at least until the downside line, down to the 38.2% (1.3367).
USD/CAD forecast
Jumping and closing above 1.3412 immediate high confirms the Falling Wedge pattern and is seen as a buying signal.
The material has been provided by InstaForex Company - www.instaforex.comfrom Forex analysis review https://ift.tt/wLB1dtu
via IFTTT