

Analyzing Tuesday's trades:
EUR/USD on 30M chart
EUR/USD traded with clear positivity on Tuesday. If the euro did not have any justifiable reasons to rise the previous day, there were even fewer on Tuesday. The economic calendar was practically empty on Monday, while reports were published in the EU and the US on Tuesday. However, these reports did not affect trader sentiment and certainly did not cause a new uptrend.
The final reading of the Eurozone Harmonized Index of Consumer Prices (HICP) for November was released. As we assumed, the second estimate did not differ from the first, and the market did not react to this report, as clearly seen in the chart below. In the afternoon, the US released reports on the construction market, but one turned out to be better than forecast, and the other worse. Therefore, this wasn't the reason why the dollar fell.
In general, we're witnessing a very strange uptrend. There are still no reasons to continue the upward movement, but the market has been buying the euro for two consecutive days. We consider it illogical for the pair to move this way, but it makes no sense to deny it.
EUR/USD on 5M chart
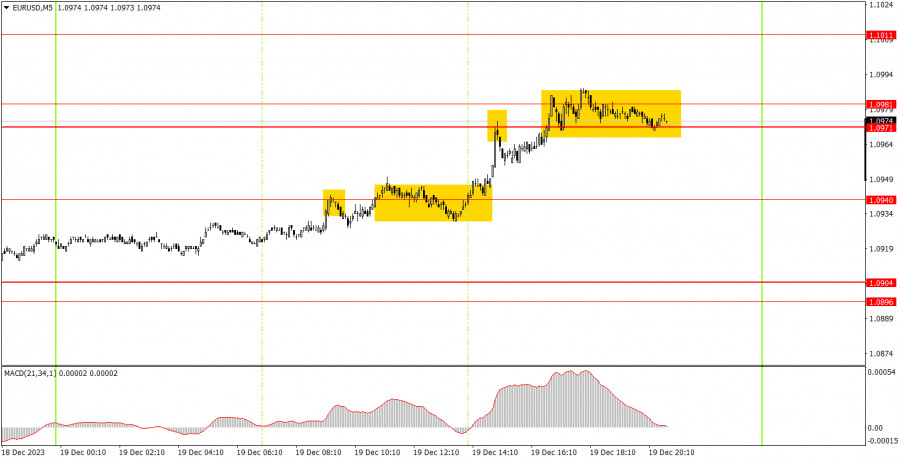
On the 5-minute chart, several signals were generated on Tuesday. Unfortunately, during the European session, the price was practically stationary, but during the US session, it moved much more actively. The first trading signal turned out to be a false signal – the price bounced off the level of 1.0940 but could not even fall by 15 pips. Then there was a breakthrough of the level of 1.0940 and the pair rose to the level of 1.0971, from which it immediately rebounded. In total, three signals, two of which were false. Beginners received a small loss on Tuesday.
Trading tips on Wednesday:
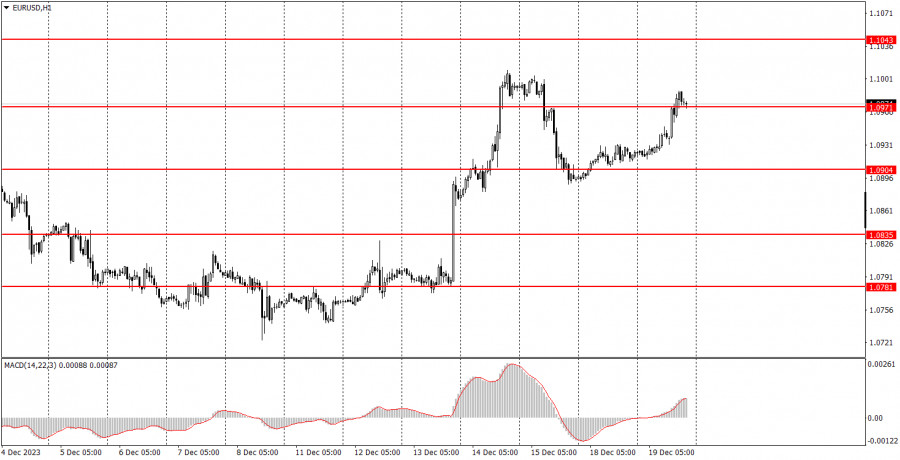
On the hourly chart, EUR/USD maintains an uptrend. However, if last week, traders had good reasons to buy the euro, this week there are none, but the euro is still rising. We believe that the euro does not have enough reasons to rise further. Last week, the growth was supported by the fundamental background, but it will no longer receive the same support this week.
On Wednesday, we advise that you use the 1.0971-1.0981 area as a reference point. If the pair consolidates below it, then it is advisable to sell the pair with targets at 1.0940 and 1.0904. If the pair breaks through this area, then it is advisable to buy with targets at 1.1011 and 1.1043.
The key levels on the 5M chart are 1.0611-1.0618, 1.0668, 1.0733, 1.0767-1.0781, 1.0835, 1.0896-1.0904, 1.0940, 1.0971-1.0981, 1.1011, 1.1043, 1.1091, 1.1132-1.1145. On Wednesday, there are no important events planned in the European Union and the United States. We would like to say that we should expect a flat and low volatility, but there were also few important events on Tuesday, and the pair moved quite actively. We expect the euro to fall on Wednesday.
Basic trading rules:
1) Signal strength is determined by the time taken for its formation (either a bounce or level breach). A shorter formation time indicates a stronger signal.
2) If two or more trades around a certain level are initiated based on false signals, subsequent signals from that level should be disregarded.
3) In a flat market, any currency pair can produce multiple false signals or none at all. In any case, the flat trend is not the best condition for trading.
4) Trading activities are confined between the onset of the European session and mid-way through the U.S. session, post which all open trades should be manually closed.
5) On the 30-minute timeframe, trades based on MACD signals are only advisable amidst substantial volatility and an established trend, confirmed either by a trend line or trend channel.
6) If two levels lie closely together (ranging from 5 to 15 pips apart), they should be considered as a support or resistance zone.
How to read charts:
Support and Resistance price levels can serve as targets when buying or selling. You can place Take Profit levels near them.
Red lines represent channels or trend lines, depicting the current market trend and indicating the preferable trading direction.
The MACD(14,22,3) indicator, encompassing both the histogram and signal line, acts as an auxiliary tool and can also be used as a signal source.
Significant speeches and reports (always noted in the news calendar) can profoundly influence the price dynamics. Hence, trading during their release calls for heightened caution. It may be reasonable to exit the market to prevent abrupt price reversals against the prevailing trend.
Beginning traders should always remember that not every trade will yield profit. Establishing a clear strategy coupled with sound money management is the cornerstone of sustained trading success.
The material has been provided by InstaForex Company - www.instaforex.comfrom Forex analysis review https://ift.tt/8PbMOo3
via IFTTT