

Analyzing Friday's trades:
EUR/USD on 1H chart
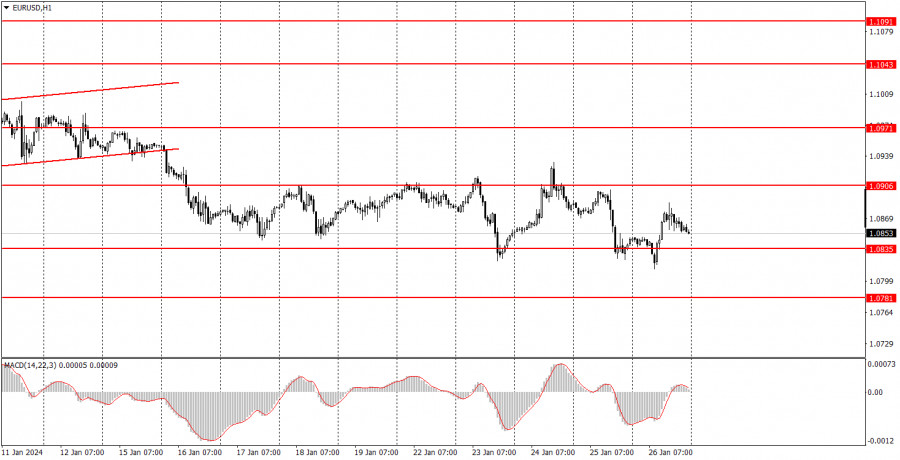
EUR/USD generally continued to trade within a sideways channel on Friday, which it has been in for the past two weeks. There was a break below the lower boundary of this channel – the level of 1.0835 – at the beginning of the day. However, this turned out to be a false breakout, and the euro quickly returned to its familiar range. Therefore,we can say that the downtrend persists, but at the same time, we have predominantly observed sideways movement for two weeks now. Moreover, there are no clear boundaries of the sideways channel, which is even worse.
We believe that the euro should fall in the near future. Despite the 250-pip decline, it still seems too expensive relative to the US dollar, considering the current fundamental and macroeconomic background. Among the interesting reports on Friday, we can only highlight the core Personal Consumption Expenditures (PCE) Price Index and Personal Income/Spending of the American population. The values of these reports turned out to be neutral and had no impact on the pair's movement.
EUR/USD on 5M chart
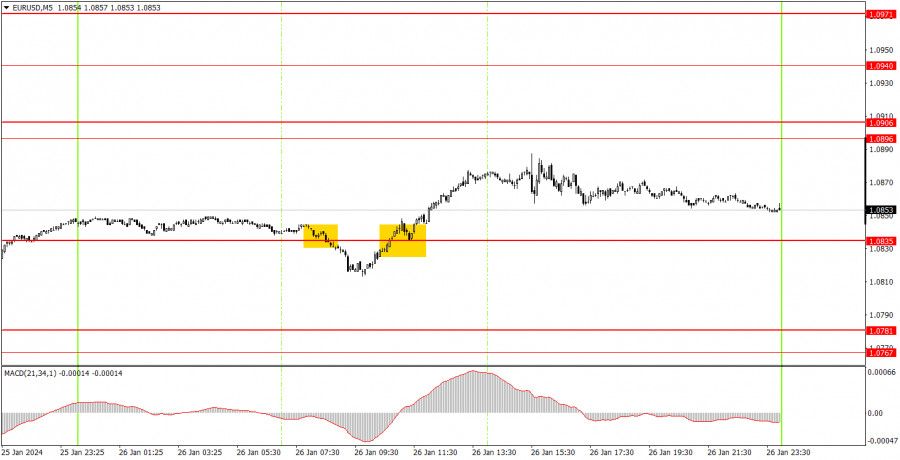
Only two trading signals were generated on the 5-minute timeframe. Initially, the pair surpassed the level of 1.0835 (as mentioned above) in the intended direction, but after this, it failed to move by even 15 pips. Therefore, the trade closed at a loss when a buy signal was formed – a breakout of the same level of 1.0835, but this time it was a break above. This signal turned out to be better than the previous one, but the pair did not reach the target level of 1.0896. Therefore, the long position had to be manually closed at any time during the U.S. session. The profit was about 15-20 pips, which at least covered the loss from the first trade.
Trading tips on Monday:
On the hourly chart, EUR/USD still has a chance to form a new downtrend since it previously settled below the ascending channel. However, at the moment, the pair remains within the sideways channel of 1.0835-1.0906. Therefore, we expect the pair to fall further, but first, the price must leave this range.
On Monday, we expect a continuation of either a gradual downward movement or sideways movement. Since there are no clear boundaries for the channel anymore, we can expect any kind of movement, and traders may ignore the levels. We believe that the price will continue to edge down, but an absolutely empty event calendar may result in low volatility for the pair, maintaining a sideways direction.
The key levels on the 5M chart are 1.0668, 1.0733, 1.0767-1.0781, 1.0835, 1.0896-1.0904, 1.0940, 1.0971-1.0981, 1.1011, 1.1043, 1.1091, 1.1132-1.1145, 1.1184. There are almost no significant events on Monday. European Central Bank Vice President Luis de Guindos will deliver a speech, which might be interesting as the central bank meeting just took place. However, we do not expect a strong market reaction in any case.
Basic trading rules:
1) Signal strength is determined by the time taken for its formation (either a bounce or level breach). A shorter formation time indicates a stronger signal.
2) If two or more trades around a certain level are initiated based on false signals, subsequent signals from that level should be disregarded.
3) In a flat market, any currency pair can produce multiple false signals or none at all. In any case, the flat trend is not the best condition for trading.
4) Trading activities are confined between the onset of the European session and mid-way through the U.S. session, after which all open trades should be manually closed.
5) On the 30-minute timeframe, trades based on MACD signals are only advisable amidst substantial volatility and an established trend, confirmed either by a trendline or trend channel.
6) If two levels lie closely together (ranging from 5 to 15 pips apart), they should be considered as a support or resistance zone.
How to read charts:
Support and Resistance price levels can serve as targets when buying or selling. You can place Take Profit levels near them.
Red lines represent channels or trend lines, depicting the current market trend and indicating the preferable trading direction.
The MACD(14,22,3) indicator, encompassing both the histogram and signal line, acts as an auxiliary tool and can also be used as a signal source.
Significant speeches and reports (always noted in the news calendar) can profoundly influence the price dynamics. Hence, trading during their release calls for heightened caution. It may be reasonable to exit the market to prevent abrupt price reversals against the prevailing trend.
Beginning traders should always remember that not every trade will yield profit. Establishing a clear strategy coupled with sound money management is the cornerstone of sustained trading success.
The material has been provided by InstaForex Company - www.instaforex.comfrom Forex analysis review https://ift.tt/OTycKkp
via IFTTT