The wave pattern for the GBP/USD pair remains quite complex and very ambiguous. For a while, the wave picture seemed quite convincing, suggesting the formation of a downward set of waves with targets below the 1.2300 level. However, in practice, the demand for the US dollar increased too much to realize this scenario.
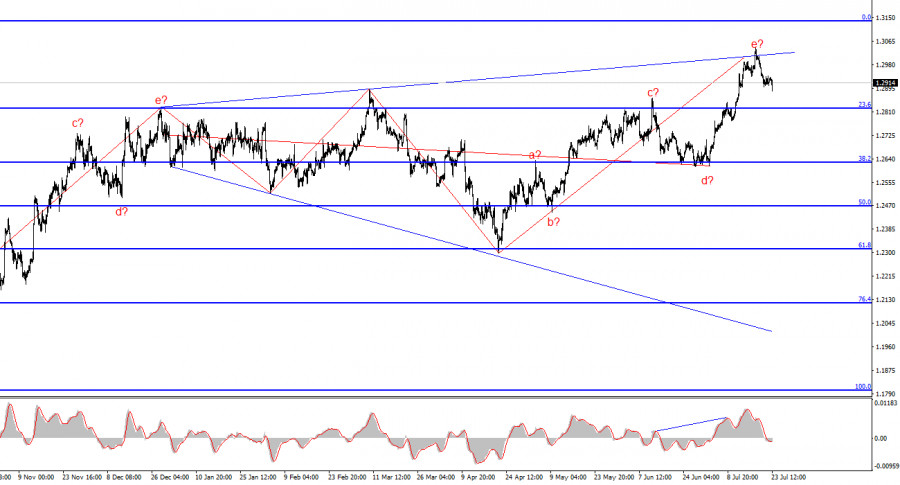
At present, the wave pattern has become completely unreadable. I use simple structures in my analysis since complex ones have too many nuances and ambiguities. Now we see an upward wave that overrode a downward one, which overrode the previous upward wave, which overrode the previous downward one. The only thing that can be assumed is an expanding triangle with an upper point around the 1.3000 level and a balancing line around the 1.2600 level. Last week, the upper line of the triangle was reached, and the failed attempt to break it indicates the market's readiness to form a downward set of waves.
The pound is ready to fall, but it needs help
The GBP/USD pair decreased by 15 basis points on Tuesday. This is very little; the market still hesitates to reduce demand for the pound and increase it for the dollar. As we can see, the EUR/USD pair moves much more predictably. The pound has formed a new reversal pattern, an "expanding triangle," but it is not rushing downward even after this. I now doubt the pound even when the overall picture looks completely clear.
The main issue for the pound remains inflation in the UK. The main indicator has decreased to the Bank of England's target, which already allows for the start of easing monetary policy. However, economists have identified a new problem for the BoE that prevents it from transitioning to a looser policy. This problem is inflation in the services sector. It has been found that most of the recent success in reducing inflation has been driven by the goods sector. Prices for goods decreased rapidly, while prices for services decreased more slowly and less significantly. Therefore, in the end, we saw a significant reduction in headline and core inflation, but the services sector continues to cause concern for the British regulator. The BoE may refuse to lower the interest rate at the next meeting in August due to this issue.
The market, which remains supportive of the pound even without this information, feels that the moment of easing in the UK may be postponed for several more months and is in no hurry to sell the pound. It continues to overlook similar factors related to the Fed. Therefore, the GBP/USD pair is expected to decline based on the wave pattern, geometric pattern, the overbought condition of the pound, and news regarding the Fed's monetary policy. However, it will all depend on the market participants. Therefore, I would trust these factors with caution.
General Conclusions
The wave pattern of the GBP/USD pair still suggests a decline. If a new upward trend section started on April 22, it has already taken on a five-wave form. Therefore, we should now expect at least a three-wave correction. The failed attempt to break the upper line of the triangle indicates the market's readiness to form a downward set of waves. In the near future, considering selling the pair with targets around 1.2820 and 1.2627, corresponding to 23.6% and 38.2% Fibonacci levels, should be considered.
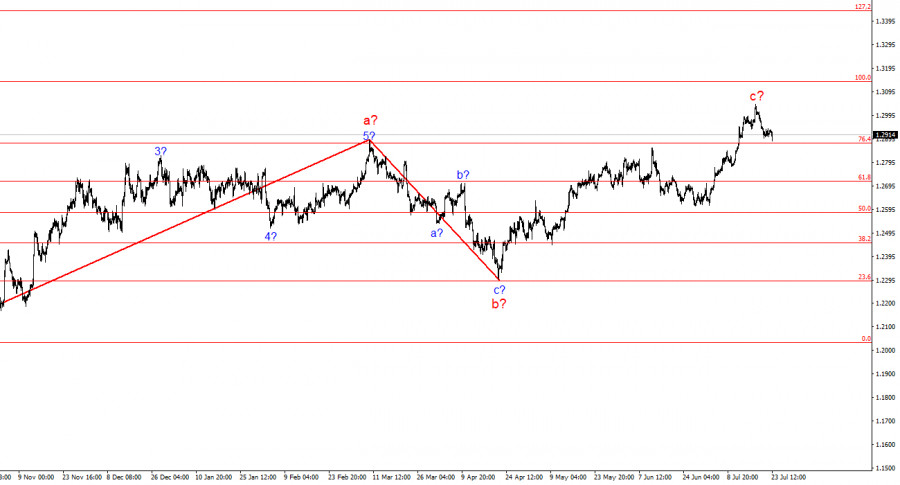
The wave pattern has evolved on the higher time scale. Now, we can assume the formation of a complex and extended upward correction structure. This is currently a three-wave structure but may evolve into a five-wave structure, which could take several more months or longer to complete.
Key Principles of My Analysis:
- Wave structures should be simple and understandable. Complex structures are difficult to play out and often change.
- If there is uncertainty about market conditions, it is better to avoid entering the market.
- There can never be 100% confidence in the direction of movement. Remember protective stop-loss orders.
- Wave analysis can be integrated with other types of analysis and trading strategies.
from Forex analysis review https://ift.tt/Emzg38w
via IFTTT

