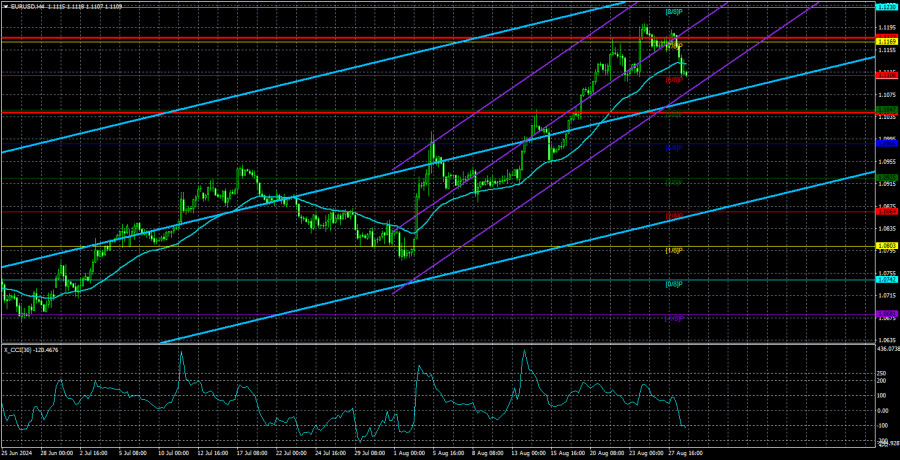
On Wednesday, the EUR/USD pair finally showed a downward movement, but we wouldn't rush to pop the champagne. Throughout the year's first half, we consistently pointed out that the euro already looked overbought. Now, when it also intends to form some semblance of an upward trend on higher time frames, confidence that the euro is excessively expensive has only increased.
We have repeatedly listed several facts that provide no grounds for the euro's rise. To begin with, the European Central Bank has already started easing monetary policy, and the ECB's rate was never close to the Federal Reserve's peak rate. Thus, the ECB's rate has been lower for years and started to decrease first. How, then, can the rise of the euro be explained?
The explanation is simple – the market has again executed one of its favorite strategies. When a certain event is inevitable, the market tries to price it in advance to maximize profits. This is why we have seen the dollar fall for two years. When inflation in the US began to slow down in 2022, the market started to expect a rate cut and factored this process into the dollar exchange rate. In recent weeks, as the market feels that "the time has come," we are seeing a final push aimed at "seizing all the gains" from the market.
On September 18, the Fed will begin to lower the rate, but it will do so gradually. This is not required, as inflation is too far from the target level. Thus, we will get a very interesting picture. The US dollar has been falling for two years since the market has been preparing for the Fed's monetary easing all this time. And what can happen after September 18? That's right; the easing will begin and is already priced in. Therefore, we won't be surprised if the dollar continues to fall for a while due to momentum, as it would be too predictable if a new downward trend started on September 19, followed by a long and global appreciation.
By then, many traders will wonder why the dollar rises when the Fed lowers the key rate. It will be for the same reasons the euro is rising now when the ECB is lowering its rate. Therefore, as before, we are preparing for a significant rise in the American currency. As we can see, the preparatory process has taken much longer than anticipated, and the market presented several unpleasant surprises. However, we still believe that the dollar's growth is inevitable. Moreover, we still believe the EUR/USD rate will return to price parity over the next 12-18 months. A lot can happen in a year and a half that may force us to adjust our forecasts. But for now, this is the scenario we are working with.

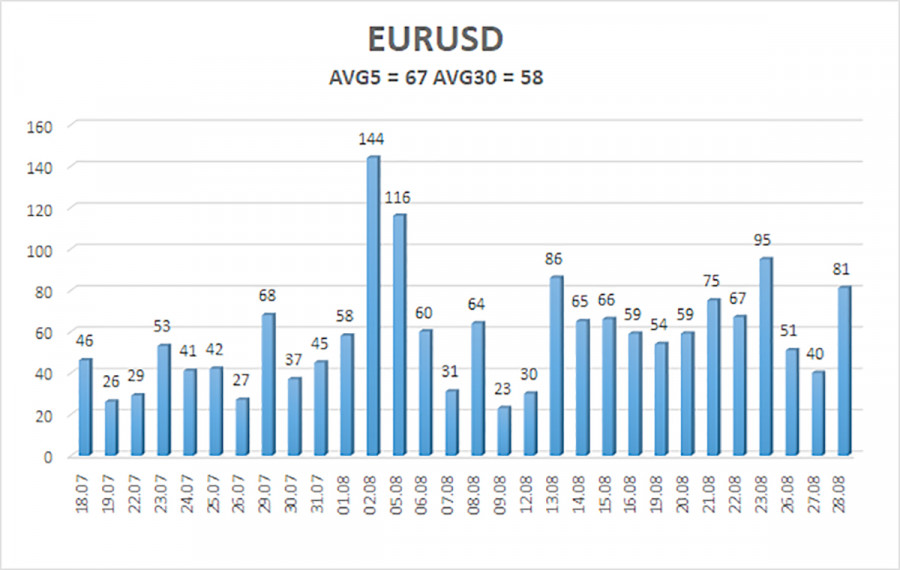
The average volatility of EUR/USD over the past five trading days as of August 29 is 67 pips, which is considered average. We expect the pair to move between the levels of 1.1043 and 1.1177 on Thursday. The upper linear regression channel is directed upwards, but the global downward trend remains intact. The CCI indicator entered the overbought area three times, signaling a potential shift to a downtrend and highlighting how the current rise is illogical.
Nearest Support Levels:
- S1 – 1.1108
- S2 – 1.1047
- S3 – 1.0986
Nearest Resistance Levels:
- R1 – 1.1169
- R2 – 1.1230
- R3 – 1.1292
Trading Recommendations:
The EUR/USD pair continues its strong and relentless upward movement due to the market's desire to constantly buy euros and sell dollars. In previous reviews, we mentioned that we only expect declines from the euro in the medium term, but the current rise now seems almost like a mockery. The market continues to seize every opportunity to buy, but the technical picture warns of a high probability of the uptrend ending. Short positions can be considered, as the price settled below the moving average yesterday, with targets at 1.1047 and 1.0986.
Explanations for Illustrations:
Linear Regression Channels: help determine the current trend. If both are directed in the same direction, it means the trend is strong at the moment.
Moving Average Line (settings 20,0, smoothed): defines the short-term trend and the direction in which trading should be conducted.
Murray Levels: target levels for movements and corrections.
Volatility Levels (red lines): the probable price channel in which the pair will spend the next 24 hours, based on current volatility indicators.
CCI Indicator: Entering the oversold area (below -250) or the overbought area (above +250) means a trend reversal in the opposite direction is approaching.
The material has been provided by InstaForex Company - www.instaforex.comfrom Forex analysis review https://ift.tt/HoWKkaQ
via IFTTT
