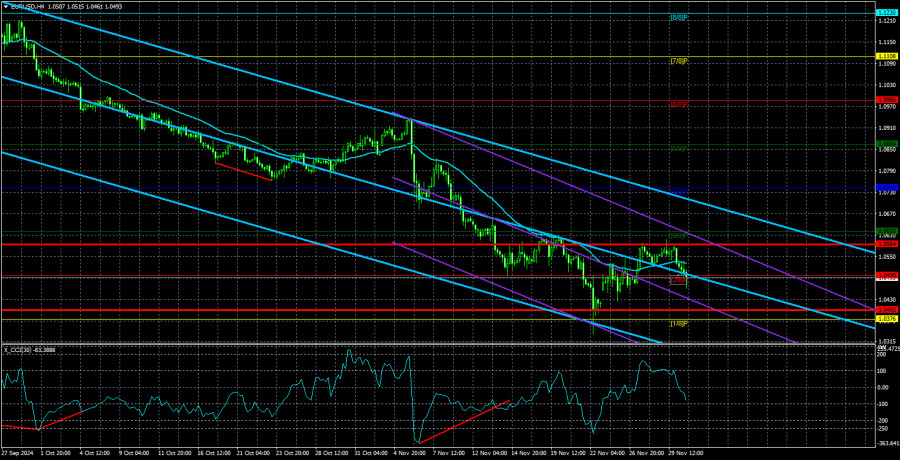
The EUR/USD currency pair consolidated below the moving average line on Monday. Both the day and the week started positively for the U.S. dollar. The U.S. currency began to rise without any clear catalyst despite no macroeconomic reports being scheduled for the overnight hours. In our view, the market demonstrated right from the start of this crucial week that it is looking downward. However, traders should not be misled by this assumption. If most of the reports from the U.S. turn out weak, the market's sentiment (at least in the short term) could quickly shift. With only one day of this important week behind us, it is still too early to conclude. The most interesting developments are yet to come.
In principle, there's nothing to add to what we mentioned over the weekend. We still believe that last week's movement was just a technical correction. If so, the decline could resume this week, which might be very painful for the euro. While the euro may still have a chance to remain in the horizontal channel on the weekly timeframe, avoiding a drop below 1.0450, a breach of this level would almost certainly result in a fall to the 1.00–1.02 range. It would be reasonable to assume that the 16-year downtrend remains intact within this range. In this scenario, we could expect the last low at 0.9500 to be updated. The current technical picture suggests not just a decline for the euro but a significant one.
Of course, it's possible that the dollar, rather than the euro, could weaken this week. The market remains sensitive to the U.S. labor market and unemployment data, but we believe these factors are no longer paramount. The key focus now is on the Federal Reserve's concerns regarding the implications of Donald Trump's presidency. Over the past couple of months, many have speculated that inflation in the U.S. could be higher under Trump than under any Democrat. This would force the Fed to raise interest rates or cut them less aggressively than anticipated.
For context, over the last two years, the market has been pricing in the Fed's anticipated monetary easing, with expectations of 6–7 rate cuts of 0.25% each for 2024. However, it now seems clear that these 6–7 cuts won't happen, and the total reduction may be far smaller. Moreover, the European Central Bank's monetary policy easing hasn't been priced in nor fully considered the relative state of the U.S. and EU economies. Now that the ECB has acknowledged its dire state in the economy, the market has also "recognized" the lack of GDP growth over the past two years. We believe the dollar still has room for further appreciation.

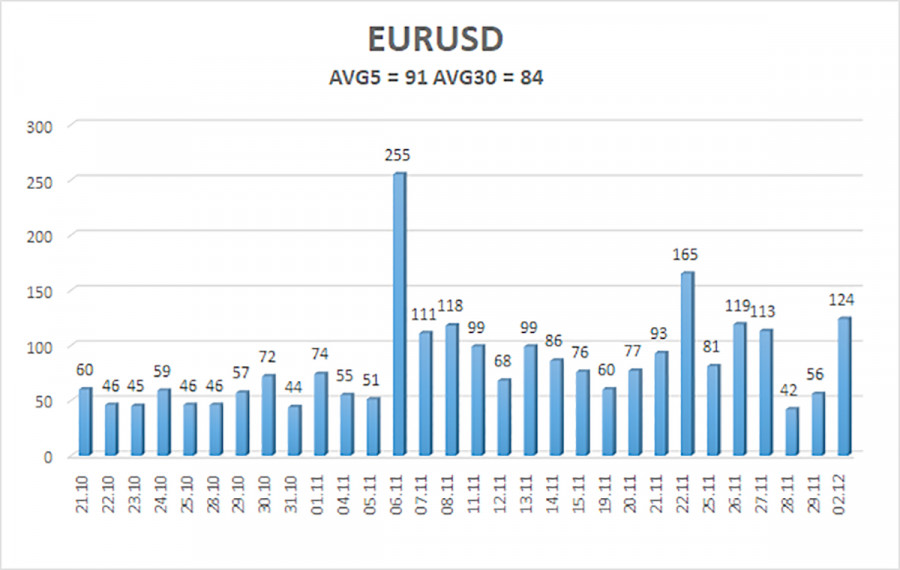
As of December 3, the average volatility of the EUR/USD currency pair over the last five trading days is 91 pips, which is classified as "average." On Tuesday, we expect the pair to move between the levels of 1.0402 and 1.0584. The higher linear regression channel points downward, indicating that the overall downward trend remains intact. The CCI indicator has entered the oversold zone several times, triggering an upward correction.
Nearest Support Levels
- S1 – 1.0498
- S2 – 1.0376
- S3 – 1.0254
Nearest Resistance Levels
- R1 – 1.0620
- R2 – 1.0742
- R3 – 1.0864
Trading Recommendations:
The EUR/USD pair could resume its downward trend. In recent months, we have consistently highlighted our expectation of a decline in the euro in the medium term, fully supporting the overall bearish trend direction. There is a high likelihood that the market has already priced in all or nearly all of the Fed's future rate cuts. If this is the case, the dollar still has no fundamental reason for a medium-term decline—though it had a few reasons before.
If the price remains below the moving average, short positions can be considered, with targets at 1.0376 and 1.0254. For those trading on "pure" technical analysis, long positions can be considered if the price is above the moving average, with targets at 1.0620 and 1.0695. However, we currently do not recommend long positions to anyone.
Explanation of Illustrations:
Linear Regression Channels help determine the current trend. If both channels are aligned, it indicates a strong trend.
Moving Average Line (settings: 20,0, smoothed) defines the short-term trend and guides the trading direction.
Murray Levels act as target levels for movements and corrections.
Volatility Levels (red lines) represent the likely price range for the pair over the next 24 hours based on current volatility readings.
CCI Indicator: If it enters the oversold region (below -250) or overbought region (above +250), it signals an impending trend reversal in the opposite direction.
The material has been provided by InstaForex Company - www.instaforex.comfrom Forex analysis review https://ift.tt/dRh6Ml9
via IFTTT
