On Monday, during the first half of the day, the GBP/USD pair showed no interest in declining. While the euro started falling overnight, this development did not affect the pound. To clarify, the euro and the pound often correlate strongly. Thus, if the euro begins to fall unexpectedly, one would naturally expect the pound to follow suit. However, the British currency continues to decline much more slowly than expected and rises more confidently than the euro. We've noted this since the beginning of the year, and nothing has changed so far.
As before, we believe that the primary factor supporting the British currency is the indecision of the Bank of England. Both the European Central Bank and the Federal Reserve are objectively cutting rates more quickly, while the BoE remains unsure about what concerns it more: the prospect of accelerating inflation or weak economic growth. We would even argue that it's not just BoE's indecision keeping the pound afloat but the market's complete lack of clarity on what to expect next from the British central bank. In reality, the dollar should be strengthening against the pound—and it is—but because the ECB is taking a more dovish stance than the BoE, the pound sterling is falling slower.
That said, we don't believe this situation will last forever. The BoE will eventually have to lower rates more decisively. Even if it doesn't and instead opts for a perpetual easing of monetary policy, the pound will simply remain under pressure for a longer period—less intense but prolonged. One way or another, the pound is likely to continue its decline.
We've long searched for any reasons that could justify a long-term decline in the dollar or a rise in the British currency—and found none. Ignoring the global technical picture, which signals an ongoing 16-year downtrend that hasn't ended yet, finding fundamental or macroeconomic factors supporting a rise in the pair is challenging. We believe the pound sterling has been in a corrective phase for the past two years and has exceeded its growth target by around 50%. Therefore, we believe that, in any case, it should continue moving south.
Of course, the forex market doesn't always follow expectations. Let's not forget that market movements are driven by market makers who can steer any currency in any direction. Moreover, some market makers aren't focused on profiting from exchange rate differences. As a result, we occasionally witness periods of entirely illogical movements unrelated to current fundamentals or macroeconomic factors. These periods are impossible to predict, so no matter how clear the picture may seem, it's essential to remember that things can always take an unexpected turn.

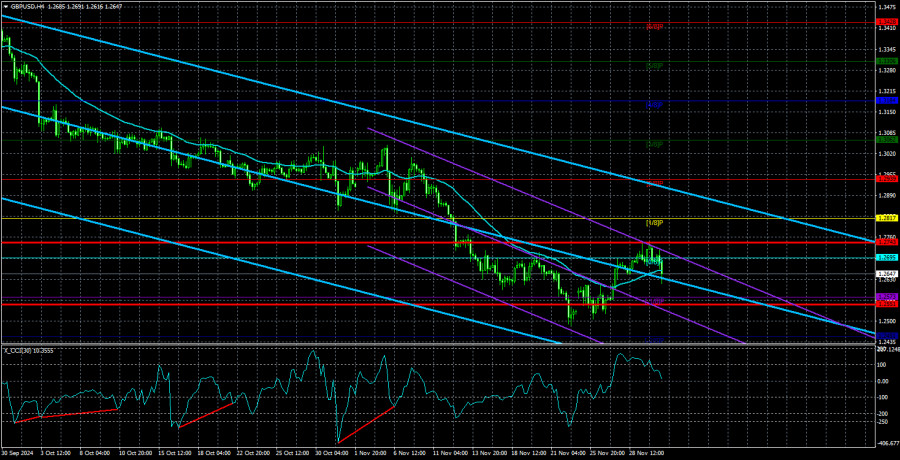
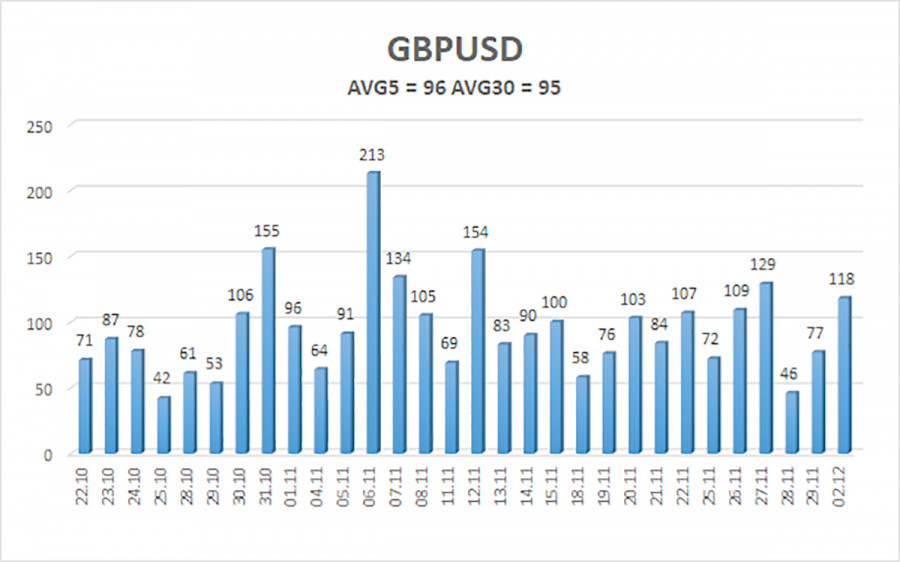
The average volatility of the GBP/USD pair over the last five trading days is 96 pips, considered "average" for this pair. On Tuesday, December 3, we expect the pair to move within the range defined by the levels 1.2551 and 1.2743. The higher linear regression channel is directed downward, signaling a bearish trend. The CCI indicator has formed several bullish divergences and entered the oversold zone multiple times. A correction has started, but its strength is difficult to predict.
Nearest Support Levels
- S1 – 1.2573
- S2 – 1.2451
Nearest Resistance Levels
- R1 – 1.2695
- R2 – 1.2817
- R3 – 1.2939
Trading Recommendations:
The GBP/USD currency pair maintains its downward trend. We are still not considering long positions, as we believe that the market has already priced in all growth factors for the British currency multiple times. For traders using "pure technical analysis," long positions are possible with targets at 1.2817 and 1.2939, provided the price is above the moving average line. However, short positions are much more relevant now, with a target of 1.2451, if the price consolidates below the moving average once again.
Explanation of Illustrations:
Linear Regression Channels help determine the current trend. If both channels are aligned, it indicates a strong trend.
Moving Average Line (settings: 20,0, smoothed) defines the short-term trend and guides the trading direction.
Murray Levels act as target levels for movements and corrections.
Volatility Levels (red lines) represent the likely price range for the pair over the next 24 hours based on current volatility readings.
CCI Indicator: If it enters the oversold region (below -250) or overbought region (above +250), it signals an impending trend reversal in the opposite direction.
The material has been provided by InstaForex Company - www.instaforex.comfrom Forex analysis review https://ift.tt/W0pH2Fv
via IFTTT
