Analysis of Wednesday trades:
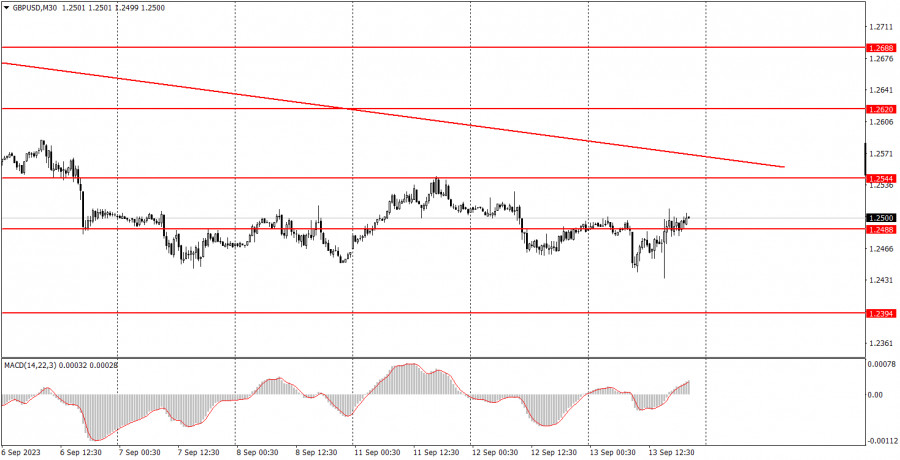
GBP/USD 30M chart

For the week's third day, the GBP/USD pair also traded with evident weakness and disarray. The price remains located below the trend line, but the movement has been sideways for a week now. Whereas the euro at least attempts an upward correction, the pound shows no such initiative. To be fair, the pound sterling is frequently weighed down by the macroeconomic landscape. For instance, today saw the release of reports on GDP and industrial production, each of which performed worse than even the most pessimistic forecasts. With such an environment, how can one expect the British currency to show growth?
However, this is something we've emphasized for quite a while: the pound has neither had nor currently has reasons to showcase prolonged and significant appreciation. As such, we anticipate its decline in any scenario. Today's U.S. inflation report triggered a sharp spike in volatility, but ultimately, it had no tangible impact. The pair continues to trade sideways, marked by subdued volatility.
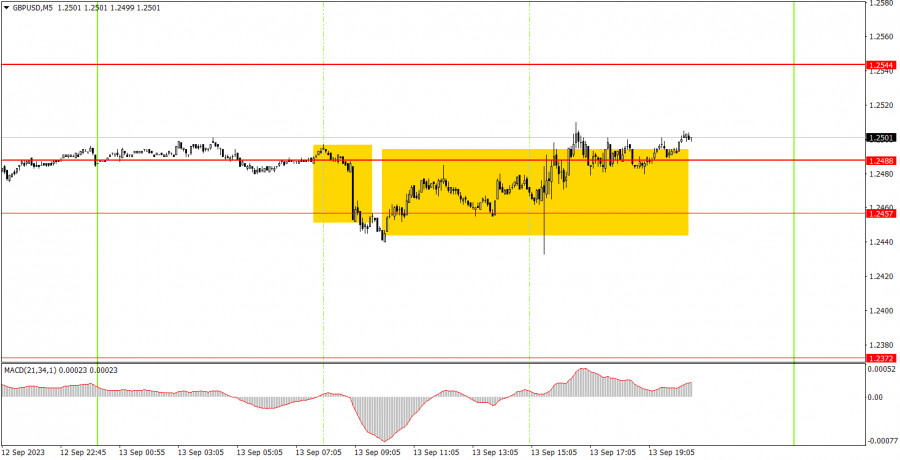
GBP/USD 5M chart

On Wednesday, on the 5-minute timeframe, the pair lingered all day around the 1.2457-1.2488 zone. Early in the European trading session, it tried to settle below this range, and at the onset of the American session, above it. Technically, these were two signals: one to sell and one to buy. However, acting on these would have been senseless. In both cases, setting a Stop Loss would require a 30-40 point range, surpassing the potential profit from the trade, especially considering the recent days' volatility which clearly dictates the potential momentum of movements. So, while the market backdrop today was strong, it was essentially meaningless.
Trading plan for Thursday:
On the 30-minute timeframe, the GBP/USD pair began its correction but has mostly moved sideways. The intraday movements remain chaotic, yet the downward trend is quite distinct. This week, the pair might try to correct itself again, but overall, we expect the same from it as we do from the EUR/USD pair – a resumption of the decline. On the 5-minute timeframe tomorrow, trading can be based around levels 1.2307, 1.2372, 1.2457-1.2488, 1.2544, 1.2605-1.2620, 1.2653, 1.2688, 1.2748, and 1.2787-1.2791. Once a trade moves in the correct direction by 20 points post-execution, a breakeven Stop Loss can be set. Thursday doesn't anticipate any significant events in the UK, while the US has three not-so-crucial reports: unemployment claims, producer price index, and retail sales. Considering the pair's stark sideways motion, we don't expect any substantial or clear trending movement from it tomorrow.
Basic rules of a trading system:
1) Signal strength is determined by the time taken for its formation (either a bounce or level breach). A shorter formation time indicates a stronger signal.
2) If two or more trades around a certain level are initiated based on false signals, subsequent signals from that level should be disregarded.
3) In a flat market, any currency pair can produce multiple false signals or none at all. In any case, the flat trend is not the best condition for trading.
4) Trading activities are confined between the onset of the European session and mid-way through the U.S. session, post which all open trades should be manually closed.
5) On the 30-minute timeframe, trades based on MACD signals are only advisable amidst substantial volatility and an established trend, confirmed either by a trend line or trend channel.
6) If two levels lie closely together (ranging from 5 to 15 pips apart), they should be considered as a support or resistance zone.
How to read charts:
Support and Resistance price levels can serve as targets when buying or selling. You can place Take Profit levels near them.
Red lines represent channels or trend lines, depicting the current market trend and indicating the preferable trading direction.
The MACD(14,22,3) indicator, encompassing both the histogram and signal line, acts as an auxiliary tool and can also be used as a signal source.
Significant speeches and reports (always noted in the news calendar) can profoundly influence the price dynamics. Hence, trading during their release calls for heightened caution. It may be reasonable to exit the market to prevent abrupt price reversals against the prevailing trend.
The material has been provided by InstaForex Company - www.instaforex.comfrom Forex analysis review https://ift.tt/wINepE6
via IFTTT
