

Analyzing Thursday's trades:
EUR/USD on 1H chart
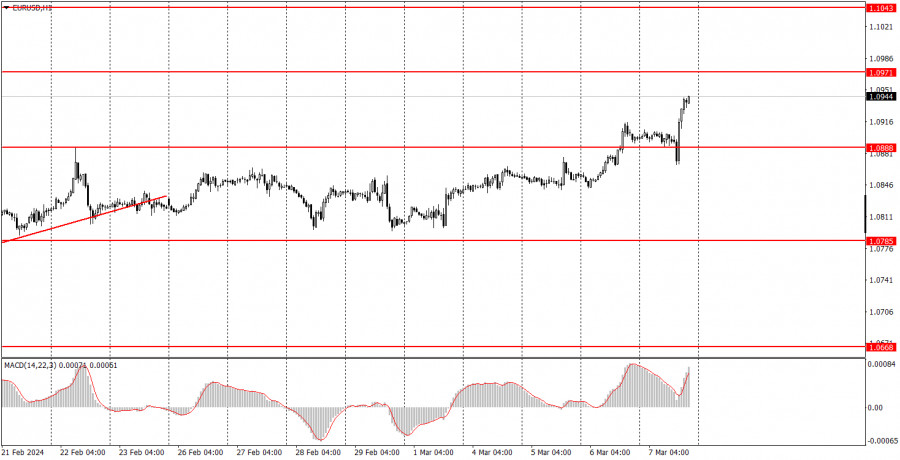
EUR/USD showed positive trades throughout Thursday. All the day's movements can be loosely divided into before European Central Bank President Christine Lagarde's speech and after. As soon as the results of the ECB meeting were announced (which, by the way, had nothing interesting), the euro started to decline. However, right after Lagarde's speech (which, by the way, also did not reveal anything important and new), the euro resumed its upward movement. We cannot logically explain either the first or the second movement. The euro's growth looks especially strange, as Lagarde's rhetoric has not changed at all. The ECB still intends to wait for more information and evidence that inflation will return to 2% in the medium term.
Nevertheless, the euro has been rising for more than a week. Until Thursday, there was also little reason for the rise. We believe that the current movement is a correction, which will end soon. However, if the market catches another bullish momentum, then the euro may rise, disregarding the fundamental and macroeconomic background.
EUR/USD on 5M chart
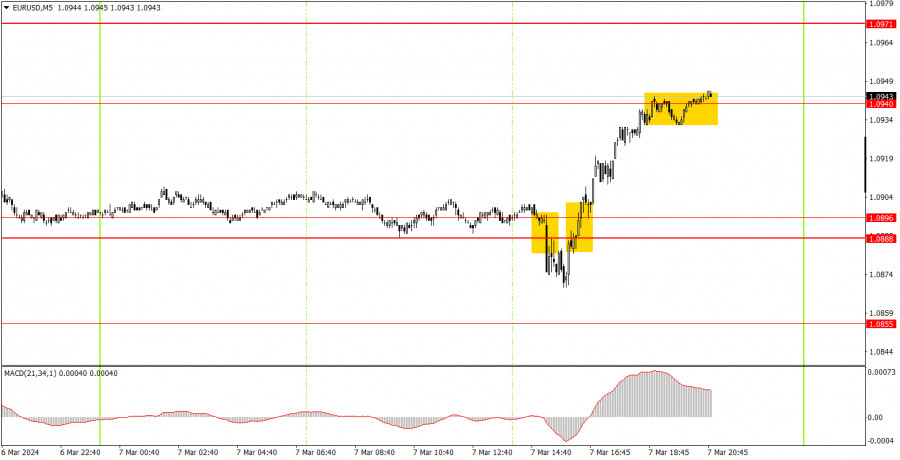
Three trading signals were generated on the 5-minute timeframe. Initially, the pair settled below the range of 1.0888-1.0906, then above it, and finally, it surpassed the level of 1.0940. Thus, at the beginning of the U.S. session, beginners could open short positions based on the initial signal, but it turned out to be a false signal. The subsequent buy signal should have been executed, and it yielded a profit of about 35 pips, which at least covered the loss from the first trade. Despite significant events on Thursday, volatility remained low.
Trading tips on Friday:
On the hourly chart, EUR/USD left the sideways channel and seems willing to resume the upward trend, although it has no reason to do so. We still expect the euro to resume its decline, which, in our opinion, should continue for quite some time, but the market is not in a rush. Even Friday's strong U.S. reports cannot guarantee that the U.S. dollar could rise.
The key levels on the 5M chart are 1.0568, 1.0611-1.0618, 1.0668, 1.0725, 1.0785-1.0797, 1.0855, 1.0888-1.0896, 1.0940, 1.0971-1.0981, 1.1011, 1.1043, 1.1091. On Friday, the third estimate of GDP for the fourth quarter will be released in the European Union. We do not expect any market reaction to this report. In the second half of the day, the U.S. will release important reports on NonFarm Payrolls and unemployment. And even if they turn out to be strong reports, we are not sure that we will see a downward movement with such a strong bullish market sentiment.
Basic trading rules:
1) Signal strength is determined by the time taken for its formation (either a bounce or level breach). A shorter formation time indicates a stronger signal.
2) If two or more trades around a certain level are initiated based on false signals, subsequent signals from that level should be disregarded.
3) In a flat market, any currency pair can produce multiple false signals or none at all. In any case, the flat trend is not the best condition for trading.
4) Trading activities are confined between the onset of the European session and mid-way through the U.S. session, after which all open trades should be manually closed.
5) On the 30-minute timeframe, trades based on MACD signals are only advisable amidst substantial volatility and an established trend, confirmed either by a trendline or trend channel.
6) If two levels lie closely together (ranging from 5 to 15 pips apart), they should be considered as a support or resistance zone.
How to read charts:
Support and Resistance price levels can serve as targets when buying or selling. You can place Take Profit levels near them.
Red lines represent channels or trend lines, depicting the current market trend and indicating the preferable trading direction.
The MACD(14,22,3) indicator, encompassing both the histogram and signal line, acts as an auxiliary tool and can also be used as a signal source.
Significant speeches and reports (always noted in the news calendar) can profoundly influence the price dynamics. Hence, trading during their release calls for heightened caution. It may be reasonable to exit the market to prevent abrupt price reversals against the prevailing trend.
Beginning traders should always remember that not every trade will yield profit. Establishing a clear strategy coupled with sound money management is the cornerstone of sustained trading success.
The material has been provided by InstaForex Company - www.instaforex.comfrom Forex analysis review https://ift.tt/W6wveIk
via IFTTT