

The demand for the US dollar is broadly decreasing across the market, and at this time, it is very difficult to identify what can save the dollar from falling further into the abyss. The wave pattern for both instruments suggests that bearish waves will form. For both instruments, prices have reached important levels around which the formation of bullish waves may end. However, in addition to the wave pattern and technical signs of the end of the dollar's decline, the market itself must have the desire to increase demand for the US currency. The current news background does not contribute much to this aspect.
Next week, the key event will be the US inflation report for February. I would like to believe in it, but recently, the market has received enough information that the Federal Reserve will shift to a more accommodative policy later rather than sooner. This information did not help the dollar. Therefore, the inflation report is a mere formality. The Consumer Price Index is expected to remain unchanged, within 3.1-3.2% YoY. Core inflation may decrease to 3.7-3.8% YoY. One might assume that such high values and a new lack of slowdown will boost demand for the US dollar, as the Fed may keep rates on hold for even longer. However, in reality, the market understands that the Fed will start to lower rates much later and much more mildly than what was assumed earlier. And despite all that, the demand for the dollar does not rise.
All that remains is to hope for key levels on both instruments and the prudence of market participants. Several minor reports in the US (retail sales, producer price index, jobless claims, industrial production, consumer sentiment index) have even less chance of helping the dollar in its unequal struggle with the euro and the pound.
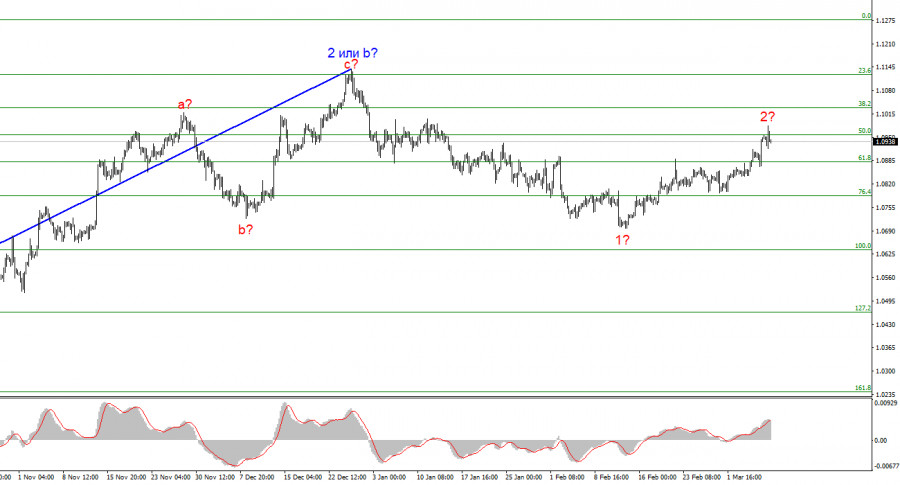
Wave analysis for EUR/USD:
Based on the conducted analysis of EUR/USD, I conclude that a bearish wave set is being formed. Wave 2 or b is complete, so in the near future, I expect an impulsive downward wave 3 or c to form with a significant decline in the instrument. An internal corrective wave is currently being formed, which could have already ended. I am considering short positions with targets around the level of 1.0462, which corresponds to 127.2% according to Fibonacci, and I am waiting for the end of the corrective wave.
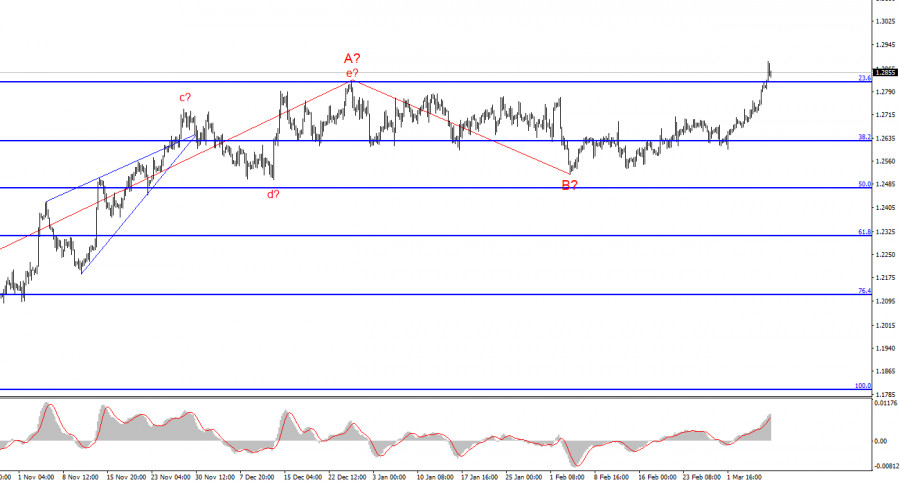
Wave analysis for GBP/USD:
The wave pattern of the GBP/USD instrument suggests a decline. I am considering selling the instrument with targets below the 1.2039 level, because I believe that wave 3 or c will start sooner or later. However, unless wave 2 or b ends, the instrument can still rise to the level of 1.3140, which corresponds to 100.0% according to Fibonacci. A successful attempt to break through the level of 1.2877, which is equivalent to 76.4% according to Fibonacci, will indicate that the market is ready to increase the demand for the instrument. In this case, you may consider long positions.
Key principles of my analysis:
Wave structures should be simple and understandable. Complex structures are difficult to work with, and they often bring changes.
If you are not confident about the market's movement, it would be better not to enter it.
We cannot guarantee the direction of movement. Don't forget about Stop Loss orders.
Wave analysis can be combined with other types of analysis and trading strategies.
The material has been provided by InstaForex Company - www.instaforex.comfrom Forex analysis review https://ift.tt/coanutN
via IFTTT